While it's obvious I have lost most of the blogging bug over time, I still enjoy getting things up here every rare once and a while. And while there are innumerable topics to discuss in this business, the more compelling ones tend to stem from a broader understanding of what we're interacting with in the first place.
Interpretations of any market are often nothing more than an extension of the past experiences (or lack of) of the observer himself. And while we want look at any market through lenses which allow us to view them in the most complex of forms, they are, at the end of the day, relatively simple mechanisms.
People buy. People sell.
Price goes up. Price goes down.
For something which, at its surface, seems so simple manages to consume extraordinary amount of time and effort because:
Making money is the primary motive of any market.
Because of this, people quickly introduce a slew of descriptions which are usually nothing more than myopic. “Surface level” is about as far as most people go, but at the surface level, we're really dealing with nothing more than a distortion of reality.
So, What Is Price?
The final product of any market is price. It is the last thing to occur in a long, drawn out decision-making process, most of which is reactionary to events. These events are the work of different types of participants, behaving in many, many different ways. They could be driven by news, the actions of other participants, or anything else.
Price is the surface. Imagine if we knew nothing about what's underneath our own earth's surface. And then an violent earthquake hits, or a volcano erupts, catching everyone off-guard. At one point in time, this is exactly the way things were. Without retelling the stories of Pompeii, etc., we all know what happened.
We can make structures/patterns out of price, and this is why I view price action as simply that: structural. But like the earth's surface, it gives us plenty of clues in terms of what's going on underneath.
For example, I can look at a long, drawn out range and also know that there is a huge concentration of volumes somewhere in the center of that range, relative to everything around it. Time, volumes and ticks are all highly correlated.
Think of it this way: of all the common price patterns ever created, should you measure their effectiveness, most won't deliver any greater than a 60% success rate verbatim. Toss on common user execution, and you are very likely well under the 50% mark. Candlestick patterns tend to be even worse because, well, the market doesn't care about what interval you're using.
People who want to knock on the “indicator” crowd tend to flaunt price action as the one and only usually because it “does not lag”, which simply isn't true. Again, it is literally the final product of a drawn out decision-making process, and if that isn't lagging than I don't know what is.
So is it useless? In the way many people tend to use it, I wouldn't say there's much benefit to it at all. But it is certainly misunderstood.
We Are Used to Categorizing Just About Everything…
In everyday life, it is helpful to categorize things.
I need a loan. I go to the bank. My financial situation looks very different than the person who came before me. I have a different job. I have kids. I have additional income. While I look very, very different than the other individual, we are put in the same category. We get the same loan with the same interest rate, based on overarching factors. The bank has categorized us, because when all is said and done we are kicking back a similar financial output.
I may pay my loan, and the other person defaults. The bank knows that based on our categorization, 1:8 customers will default. Should the macro environment get bad, that number could go as high as 1:5.
In a nutshell, this is what price action (or anything else) does. It guarantees nothing as far as future output goes. It just allows us to categorize things based on what has already happened. Stats can help us determine the likelihood of what's going to happen next, but won't explicitly tell us.
Process, Strategy, Execution
When most people begin investing or trading, instinct #1 is “find a strategy”. A+B+C=D, right?
But A, B and C are never the same. Never.
Also based on this instinct, is to take any piece of information and immediate formulate a directional strategy from it. Price action says this, we go long. Price action says this, we go short.
Yet there are vast amount of items commonly used for analysis that are completely non-directional. AND THAT'S OKAY, as long as we understand this. Many items falling into the price action bucket fit this bill 100%.
Common support and resistance levels are one of them. What guarantees do you have that a level is going to simply reverse price? None. And this is always the case. The sooner most people realize this, the better.
A few years ago I took a look at what I was doing everyday and decided to just rip it apart into 3 separate categories,
“Trading is a process” has been said so many times at this point that it seems cliché. I view process as only step one of any regular routine. Think about what an average person does in a day when it comes to analysis. A technical trader (or a fundamentally driven trader looking for better timing) will plot levels, monitor various times of the day where prices tend to flip, look at heavy areas of open interest, plot the previous day's settlement or daily / weekly / monthly opens, closes, highs and lows, etc.
How much of this directional? Barely any of it. Some of it is to a slight degree, but certainly not much. Again, no guarantees any of those levels will do what the trader hopes they will do.
So why do it? Let's say you're going on a hike in an area of rough terrain. You know you need to hike over/through a patch of mountains (no option not to). You could look at a satellite map to see trees and open fields, or you could look at a terrain map and view elevation grades. Trees can grow on steep cliffs. You could end up losing elevation you would have to gain later. The satellite map won't tell you that you will expend 5X the amount of calories, and time, to get from point A to B, but a terrain map will.
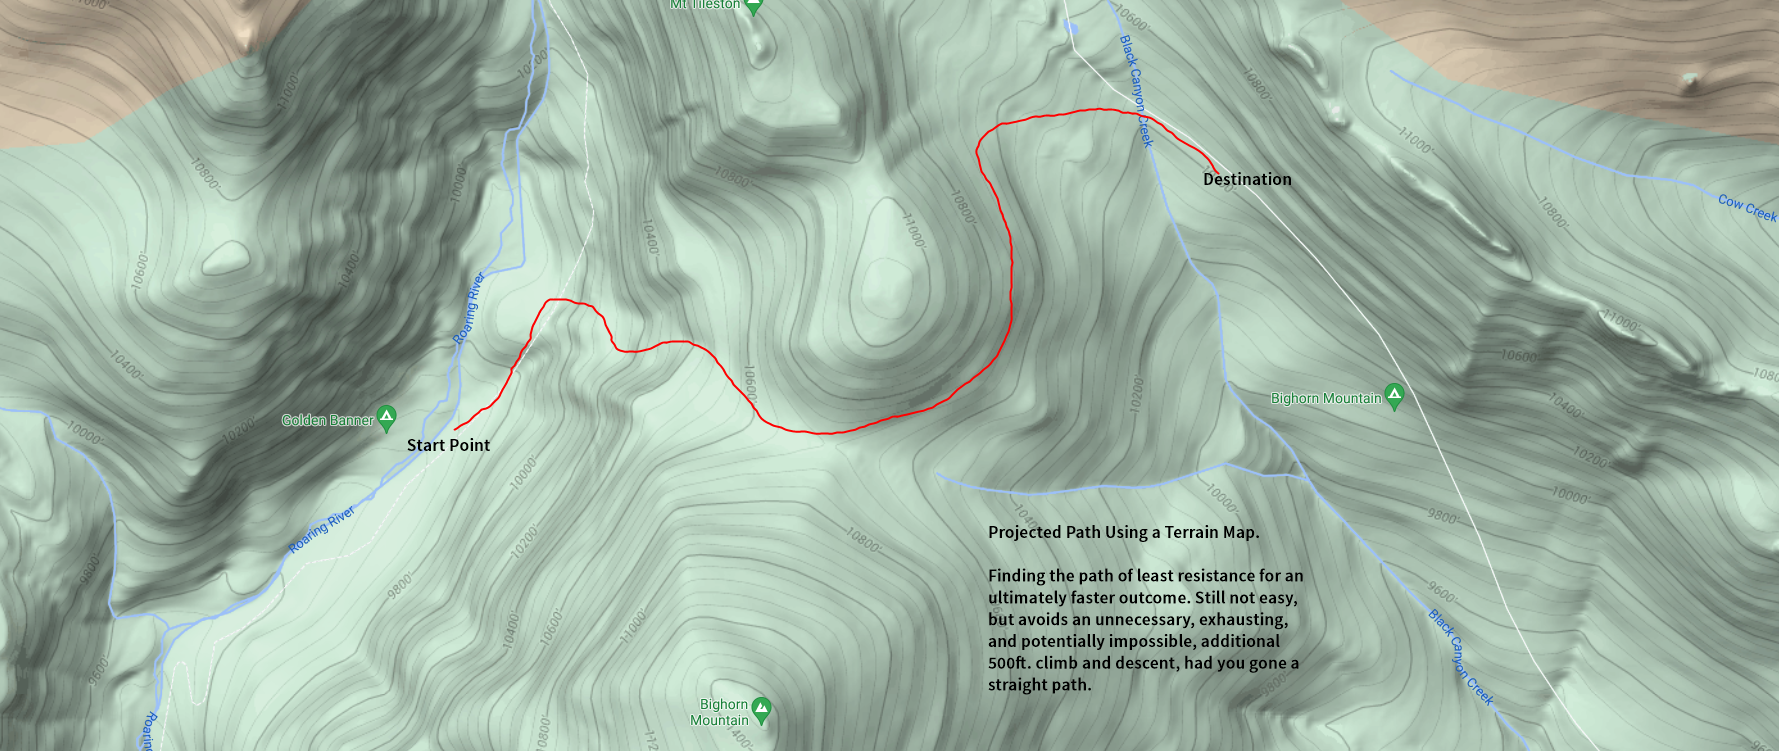
You're looking for the path of least resistance. And this is where price, or anything structural, shows its greatest strength. It has more to do with the path vs. the point.
The point is what most people focus on: exactly where to get in and out.
But then the trade opens, and the struggle begins. Let's say the person executed too early. Why? They failed to see that the current path of least resistance was against their trade. Had they focused on the path, not the point, actions likely would have looked very different.
Volumes and prices are of course related, and volumes equal friction. A high volume node will correspond with a range in prices, or just an area that poses a high degree of friction. In other words, it's a resistant path. So it's not only important to realize what a block of prices will subsequently do to price hitting it on the second time around, but why those prices are there in the first place. Again, volumes, prices and ticks are all highly correlated.
So this is process, in a nutshell. Finding paths of least resistance and entry and exit levels as a biproduct.
Strategy is directional. Certain inputs are used for this, all of which have the single goal of determining one thing: up or down. Like process-oriented items, many different things can be used for this, the most common being fundamentally-driven or in the technical (execution data and technical analysis world) book depth and executions, or a release (range expansion) from a range.
Execution is a basket of items unto itself, and needs to be regarded as such. Most people are generally good at process and strategy, but far less so at execution (or vice versa). Once a determination is made, action needs to be taken. And in any market, preemptive, late, or a lack of action is going to unravel the ball of yarn. And this is all just an individualistic effort.
So again, much of this is perceptive and just understanding what you're dealing with when it comes to different forms of analysis. There is nothing “wrong” with any of it, it's just that it is commonly misplaced.
Price Action Can Lay a Foundation
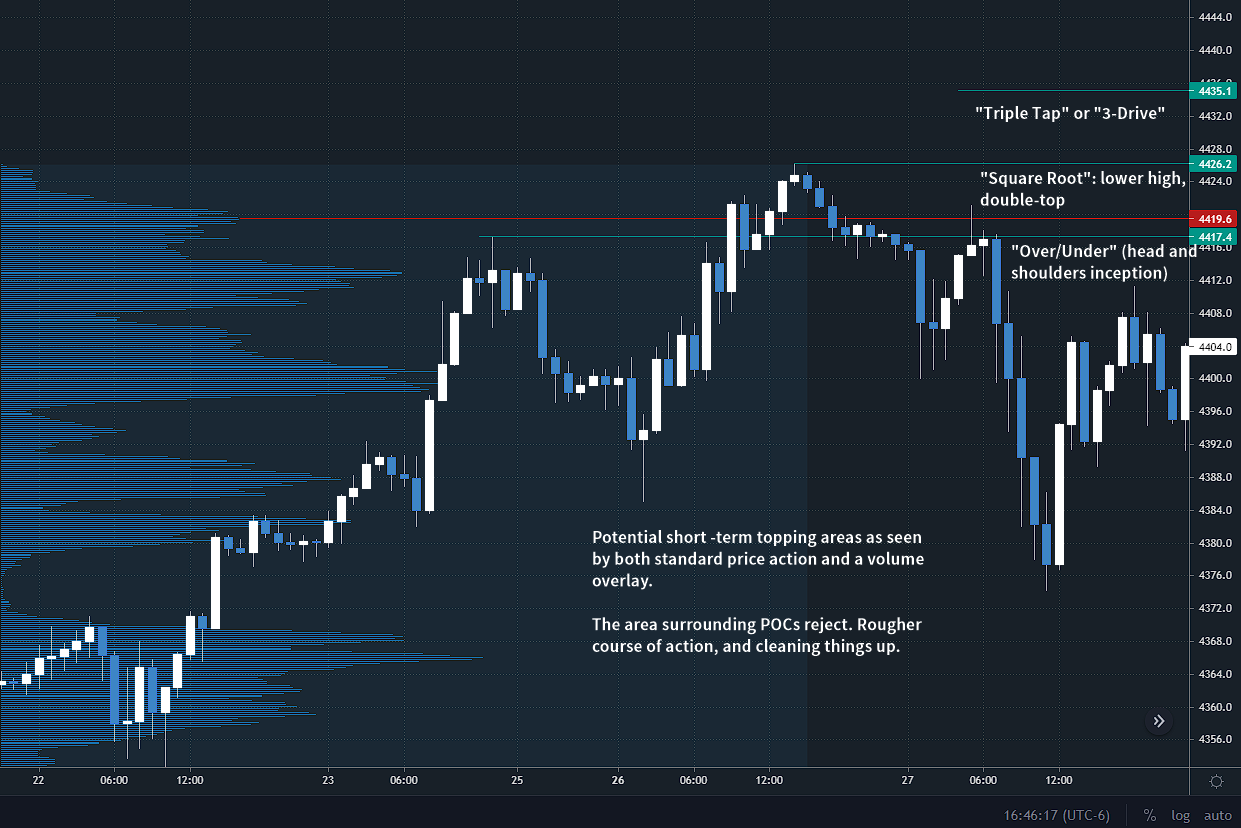
Years ago, I used to study all the different price patterns until I more or less came to the conclusions stated above. Looking through a book of over 300 price patterns I think it would be odd not to at least ask just once: “who the heck is going to remember all this stuff?”. I cut them down to just 6 different price structures because at the end of the day, these are the only ones that form around each and every turning point on your chart. Why overcomplicate it…
What they demonstrate is a temporary lack of volatility or pickup point for a continuation. The reason I would even want to look at any of them to this day is for means of timing. Knowing that an outcome is possible (a third thrust in a triple tap, or a right shoulder in an over and under, etc.) has its advantages.
Price action is easy to identify, and I think that's part of the attraction to it. I could teach a complete novice how to find a support and resistance level in a few hours and that very night, they're doing it. Find a wedge, find a head and shoulders, etc. But there is a reason most people cannot trade these patterns, also stated above.
But again, that doesn't mean there's no value; far from it. A shape or structure on a chart is better than none. Ask Ferdinand Magellan if he would have liked a map of what was around him and I'm sure he would not have turned it down. And for a moment, let's assume he had one. He still wouldn't know what's in front of him.
The only way forward is forward, so better to have the wind at your back vs. not. And that's why I talk about the “path of least resistance” so much. If we're trading, obstacles are the enemy.
Knowing where a high volume node exists (typically circa the price range center) has its value because nothing stops price more than a massive concentration of volumes. Knowing where a smaller concentration is at the top of the range following a breakout is important because this is typically the last-chance retest before prices make their move, on an expansion.
And so prices (and profile) can tell us these things. But as far as direction goes, we are in the business of reacting. See A, do B, etc. I have always though blind price forecasting is a bit useless for this reason.
Assumptions Made In Hindsight Pose Danger for Real-Time
Accumulation and distribution. What are they doing, essentially? Telling us a direction. Like price patterns, there's simply no way 100% positive way to determine if a range is accumulating or distributing with price action until a subsequent move has occurred. The same goes with supply and demand (essentially the same thing). While they serve their use in hindsight, it's hard to stress how important this is to understand.
Lately, I see a lot of Wyckoff distributions online. And sure, when the pattern plays out, its as if I can hear a symphony playing in the background. But these types of distributions have not showed their hand until price is back at an extremity and making its final movement. And of course many times, they don't do this at all.
And much of this boils down to situational awareness. When a top-level is hit over and over again, fading every time, what's happening? Could be a few things.
1. You have a dense order book. At-the-market executions are positive, but limits to sell are overweighing
2. At-the-market executions are selling the level. It may not be a lot, but it's enough.
3. Both are selling. Revisits become unlikely and you're dealing with a deep pullback or potential reversal.
And all of this is under the hood. The most simple accompaniment to price action is simply volume profile. Bottom line, it tells us where the volumes are (therefore friction).
So as a structural base, it is more than adequate, but of course there is always more to the story.
As a Meter for Volatility
Directional forecasting just refers picking a direction, up or down, for any given x period. This period is usually determined by length in price, rather than time, or any other measure. As price is hitting the brakes, this is what I've viewed as just raw price action's biggest strength: determining what's next based on range-based structures.
Humans are interesting creatures. We really do like to repeat the same processes over and over again, whether we realize we are doing them, or not. No structure is ever identical, but the sequences are extremely similar, like anything else in nature.
At the end of the day, we're looking at the inception of a common pattern based on average behavior in order to determine the future output. Once that structure is completed, however, what most people call “randomness” takes the wheel. I don't like to think that anything is truly random because it can all be measured, but other factors, not just prices, would tell us this.
This is obviously counter to what I learned in my early days browsing through technical analysis books, where we are identifying completed structures in order to “figure out what's next”. It always seemed like a recipe for craziness, at least to me. Because in the real world, most people have a serious problem pulling the trigger on something you can't see with bonafide consequences.
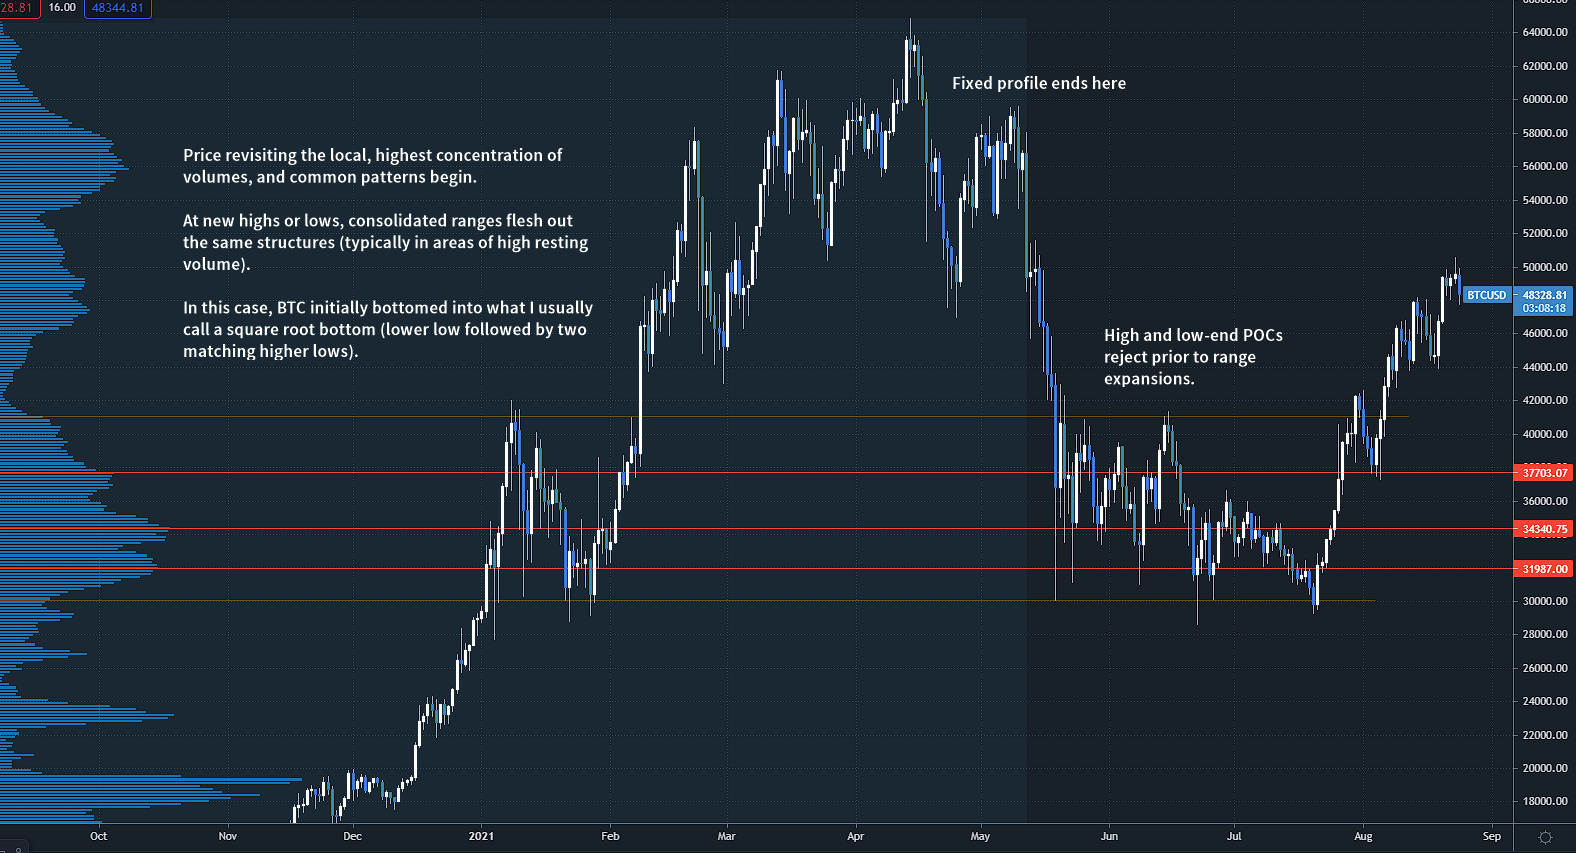
So it is the inception of patterns, in previous high-volumes areas (or areas of high resting volume) that tend to display the highest amount of interest. Aside from being early, it is the recognition that prices are rotational in high volumes areas. Tops and bottoms deflect, and in common ways we bucket into patterns. This is why the 300+ price patterns out there don't interest me anymore. By the time they're done, it's too late.
Regardless, anticipating patterns can be less precise using price action alone, so there's a degree of “wiggle room” that can be made up for by way of volumes.
Ultimately, it's the aggregation of volumes which tell the story; how large the range will be, inner and outer edges, etc. And these groupings shape the patterns you see on your charts.
In the End…
When I first started writing this blog years ago, there really wasn't a whole lot posted out there. Today, it's the exact opposite. It is also likely one of the reasons I have slowed down so much writing this blog over time here – how much more do people really need? Yet with all things typical in learning just about any market, surface levels tend to take over, because it's what stares us in the face. And this is what I (and likely you) most commonly see out there.
So if it helps, great. And as usual if not, that's okay too. I always just encourage everybody to use common sense and see things for what they are. In this case, it's understanding that you're only looking at a surface and the value is usually less obvious than it initially seems. Literally anything can be turned into a “strategy”. Price action, executions, or what time my son gets up in the morning. Every business has it set of tools, and we have those tools so they can do some work for us. But we never want to use them incorrectly; otherwise might as well not use them at all.
In the end, I view it as finding a pathway, and importantly, knowing what I'm likely to see around that path. Terrain maps are useful.


