There is a neverending debate that goes on in regards to transparency in FX, or more precisely, the “fact” volumes are nearly useless because:
- the market is decentralized, and because of this,
- volumes are only coming from one broker or,
- the only volumes that matter are streaming via EBS or Reuters or,
- tick volumes are based on ticks, not real volumes, so those too, are junk, or
- volumes coming from a futures exchange are useless as well, because they're not based on the “real thing” (interbank)
Welp, let's go down the list, and I will give you my own take on this after spending (likely too much) time in this business. A little while ago, I took a poll in Twitter to gauge the overall perception on volumes applied to FX. The results surprised me:
Ok, next one, FX traders only, and your perception on volumes:
— Steve W. (@paracurve) March 27, 2018
Futures and equity traders who have used volume for years will largely understand much of what is written below. But for FX ONLY traders lacking exposure to other markets, and who have been told that volumes are useless, I encourage you to read on:
The quick answer to most of the above depends on how you're using volumes, which will ultimately determines their value. So before we go any further, let's talk briefly about that.
Why you should trust me: I'm not here to wag credentials but because I know how easily manipulated by others people can be, I think it is worth stating: once upon a time I worked on the FX desk at Credit Suisse back in NY. It was one of the first jobs I had in the industry, and the reason I started trading it as a hobby. Many years later (nowadays) I'm heavily engaged in futures markets, and primarily trade energy, with rare options on such to serve a range of purposes. So let's get on with it:
There are two primary ways to look at volumes:
1. Total executed. This is how we generally learn to look at and use volumes. These are your standard volumes plotted on the x axis (at the bottom of your chart), as well as volume profile plotted on the y axis. Total executed volume, for trading purposes, is most commonly used in a relative sense. In other words, we are not looking at the number of finalized executions, but rather comparing the executed volume on one bar, to another (or a series of them).
We are comparing volumes, for the most part. We are not looking at the number of contracts or shares traded on their own, because they are largely useless if we have nothing to compare them to.
This matters, because what may be considered high volume on one day will NOT be considered high volume on another. But for intraday trading purposes, that “high volume” bar means the difference between an impending reversal or just an average bar in a trend.
And the next one:
2. Executions on the bid/ask and/or depth of market (DOM, aka liquidity). Executions on the bid/ask can be plotted independently of price, and is commonly referred to as delta. The depth of market displays resting orders, otherwise known as liquidity.
I use executions on the bid/ask daily in order to determine where larger participants are moving prices, thus direction. All we need to know is prices are going up or down, and executions can help you get there. The DOM can be used in many ways, the most common of which is known as the shape of the order book. In theory, if there is a heavy ratio of bids to offers, prices will go up. But this is largely an uncertainty (many studies done on this, and stats will vary wildly based on the methods used), and the rule tends only to hold in certain areas on your charts.
So much like price action, strengths and weaknesses exist and common assumptions can go defunct.
So yes or no? Which is it?
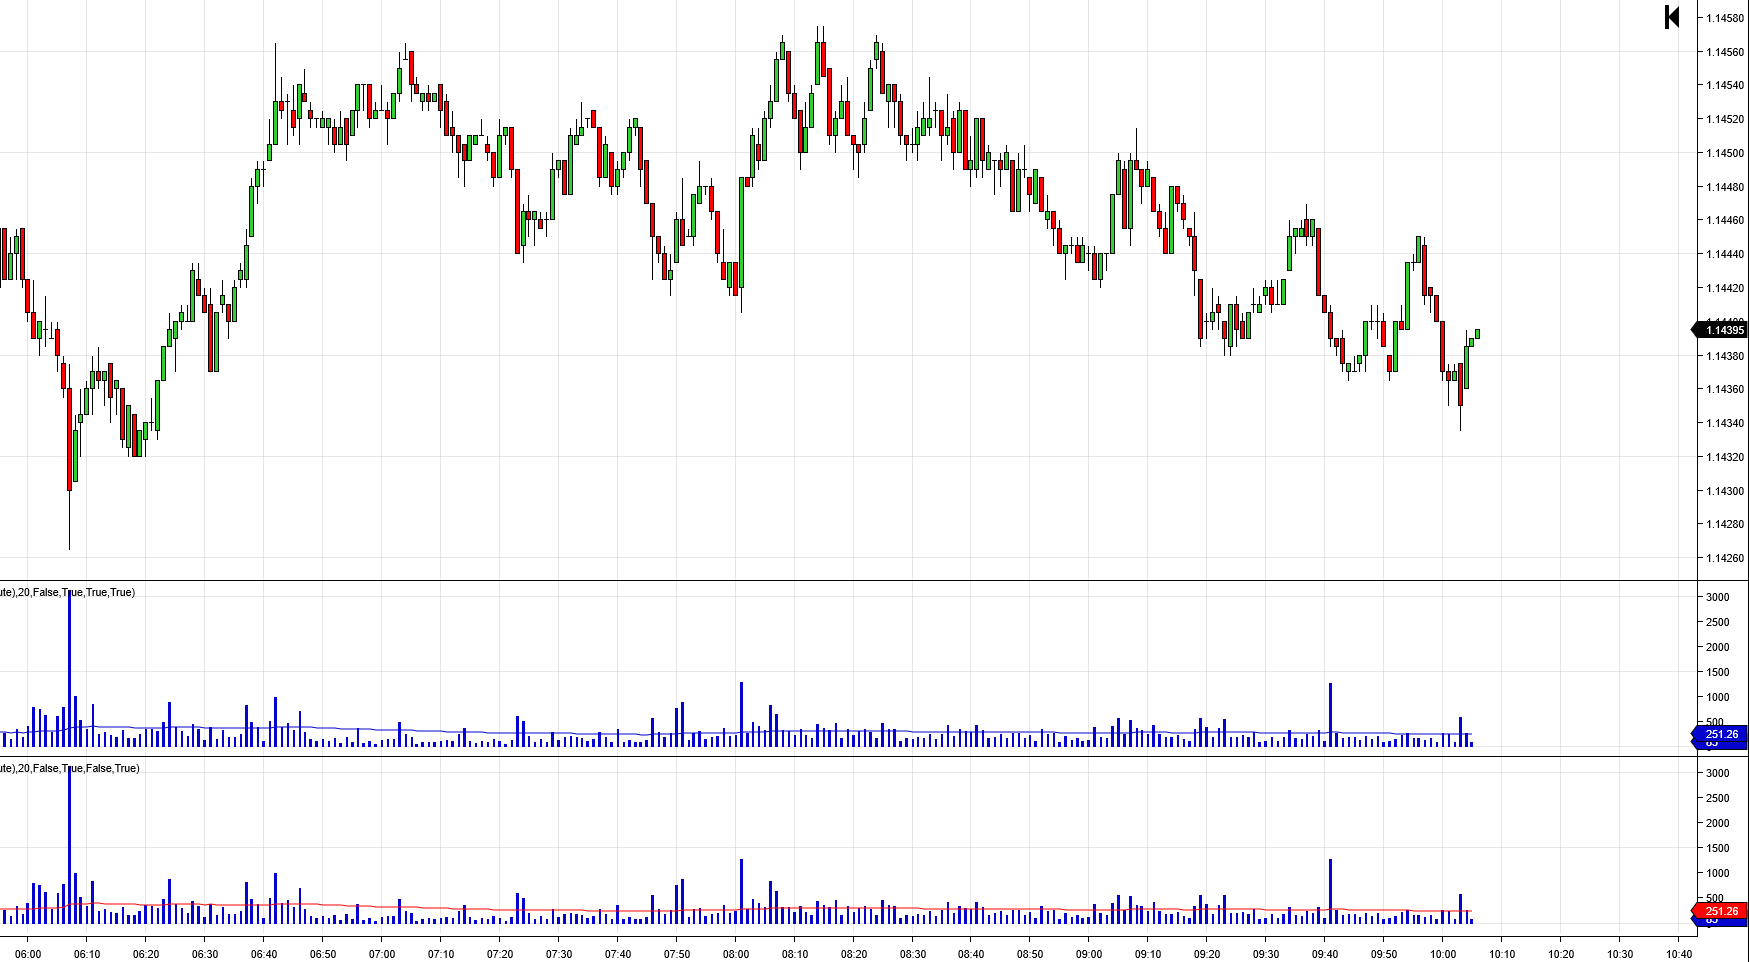
The short answer is that both of the above can be applied to FX. Let's take a look at a chart of front month EUR/USD futures on CME (6E). There at two panes on the bottom here. One is real volumes, the other is volumes as ticks. Can you tell which is which? Most people cannot, nevermind identify differences between the two.
Let's start with total executions (traditional volumes plotted on the x or y axis):
As a decentralized market, FX does a very good job of self-regulating itself in terms prices. Much of this due to the fact that arbitrage opportunities are exploited to the nth degree, making exchange rates across brokers and ECNs barely noticeable to a casual observer. This high level of efficiency normalizes prices market-wide, and with it, traded volume. You don't get one without the other.
A high volume bar on a highly liquid institutional ECN will also be a high volume bar on a standard retail broker. Conversely, a low volume bar on a highly liquid institutional ECN will likely be the same on a standard retail broker.
Much of this boils down to the efficiency stated above, as well as others factors. Many retail brokers pool liquidity via other solutions. If you have ever gone onto a retail broker's website and see a series of logos from banks (usually described as “partners” or something similar) it is because they're typically employing some kind of liquidity solution (usually plug and play via an aggregator) which combines resting order data, and routes trades appropriately.
Without a solution like this, smaller retail brokers (especially) would be left with barely anyone on the other side of the trade and an overall terrible experience for their clients, hence the pool. This is the way it has been done for a very long time now.
Volumes are oftentimes passed through as well. Much of this depends on the practices of the individual firm and how transparent they want to be. If your broker is a B model, like Gain Capital (Forex.com) you are essentially at their mercy and they are oftentimes literally taking the other side of your trade. A (agency) models pass your trade onto actual liquidity with zero intervention.
This plays into the data based on what they're willing to show. X and Y axis volumes again, are used in a relative sense. And volumes are generally consistent across the market from this angle. It is entirely up to the broker to decide what kind of volume data they display. If any questions as to how the data shows up on your screen, or where it comes from, just ask them.
Some brokers will display ticks as volumes. Others, the volumes themselves.
So…….what about tick volumes?
Look at it this way: if you have higher volumes, what else are you likely to have? A higher number of ticks.
And this is where the debate presented by the uneducated gets heated. The vast majority of what I have read on forums in regards to this is flat out, factually incorrect.
When turnover is high from a volume standpoint, price will uptick/downtick to a high degree as well. And in case you wonder if one large order can have material impact on price minus the ticks, well, this can happen, but not in the way most people would think. The vast majority of larger orders are broken up. They are simply not executed in one shot (and we're talking about a real, massive, market-moving order). Rare exceptions exist, and there is typically a high sense of urgency as a motive. But they are just that: very rare.
Iceberg orders are commonplace on exchanges. Let's say we have 1,000 lots getting executed on the ask at a certain price on x futures contract. Price will keep upicking, and downticking, at that same price (and the one below it) over, and over, and over again until enough market orders to buy have run through the exchange and all of those limit orders to sell have been executed against those market orders to buy.
Represented as tick volumes, you're going to see a lot of them vs. the level with only 10 contracts sitting on the book. 10 lot trades happen all the time and all it takes is one of them to wipe out the level.
Remember, for trading purposes, in the aggregate sense, volumes are relative. If you intend on using them in either of the senses listed above, perceive them not in static numbers, but as a percent.
Moreover, time plays into this significantly. One of the first things I try to teach people just getting into this is how to identify the state of the market, or in other words, where prices are likely to hit the brakes versus run and reverse. This principle plays heavily into where volumes get traded, and time. Specifically, where you have high areas of congestion, you also tend to see greater volumes on your volume profile. More time, more volumes, more ticks. When price finds its way back into these areas, it has a hard time getting through.
These areas are visible on a retail broker just as much as they are a single dealer platform or massive ECN. Large ares of congestion equate to large amounts of volume. Use tick charts, and you will see this as instantly visible. They always do.
It is the main reason why putting on a trade smack in the middle of these areas one of the worst places on your charts to do it. Its a swimming pool of market making and other forms of heavy inventory turnover, ripe for misdirection. But that's another post.
The bottom line is that volumes are relative market-wide because there is so much crossover activity / arbitrage / you name it. If your prices are comparable, then your relative volumes will look similar as well.
And into the abyss: Executions on the bid/ask and/or depth of market (DOM, aka resting orders aka liquidity)
I have been trading with execution data full-time for several years now. I'm not going back. Once I understood how this world works, everything I did on a very short-term basis was improved.
All of my execution data for FX (which I don't even trade much of anymore) comes from the CME. When you look at lists of volumes traded across the industry, etc., you will always see futures on these lists as well. FX futures traders have similar motives for arbitrage opportunities as interbank traders do, and the numbers prove it. It is no coincidence that any OTC product, versus the futures contract, share similar pricing profiles.
We can therefore use the execution data in order to lead the primary instrument as well, through the same methodologies used for any other standard futures contract.
You're going to have a hard time doing this on interbank data, and only because the tools for doing so are hard to come across. Sierra charts (one day they will update their website) is one of the few retail platforms (of which I'm aware) that allows you to plug in just about any external feed with ease and apply all other common studies on top of them. But I am not sure it is worth the struggle and have yet to do it myself. If you know of any others, then please comment and let us all know.
You can use ticks as volumes for “cumulative delta” as well, but you need to realize what it is you're looking at. Your relationships/divergences, etc., will all be very different than that of traditional volumes. Generally, and I say generally, it will lead prices. It's up to you to do the research and test if you intend on incorporating it into a trading strategy.
The following chart shows the difference between the two. Once again, we're looking at front month EUR/USD futures on CME. The top pane displays true executions, cumulative, the bottom, up/down ticks. Take a quick look, then read on:

The difference between these two are clear: with true cumulative volume, I can see where limit orders are playing a role in suppressing prices. As delta increases, price drops, telling me that a wall of liquidity is absorbing market orders to buy. Also remember, this is FX futures, so they're heavily arbitraged. This is a relationship I'm accustomed to with natural gas on CME, among others. The degree to which this happens varies greatly by instrument.
On the bottom, we're looking at the number of upticks vs downticks, totaled throughout the session. A slightly different story is being told here: ticks are (and I speak in a broad sense, I can't stress that enough) telling a story of pressure and in this case, is generally leading prices, but of course not always. Once you understand the nature of prices themselves, and how they are made, this becomes much more clear.
If this is confusing you, its because there's a lot to unpack here. The following videos may help you out if you want to explore this further. It is a long story, and most of what I have read on the internet from traditional websites has provided me with a big fat zero when it comes to applying any of this, which is why I made these:
So how correlated are they?
To save myself from piles of time on this, I'm going to attach the work of someone else On Twitter, @David__Belle sent me the following in response to the poll listed above. It basically presents an R² value when comparing tick and realized volumes across a range of FX instruments. The correlation proves a number of different things to us, most importantly, the fact that what we're looking at is not utterly useless….just the opposite.
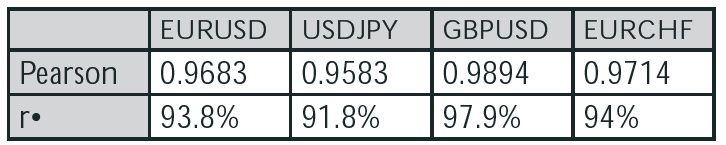
So anywhere between .918 (91.8%) and .979 (97.9%) (I prefer r over pearson). That's more than “pretty good” and certainly adequate for the vast majority of traditional strategies.
Other studies I have read in the past confirms this. So as a retail trader, what should you do? Just find a broker with adequate liquidity. So basically, stay away from market making, B-model brokers. You shouldn't be giving them your business, anyway, for many other reasons, not just this. ECNs are preferred, but I realize that true agency models to find.
Ticks as volumes for volume profile are more than adequate as well. Just realize that POCs will have more in common with market profile (time) than volume profile, when you're using it. I strongly encourage all traders to go down this path and understand it. Follow me on Twitter if you want more examples of this. I post a decent amount there.
So that's about it for today. Hope this helps, and please post any comments below. This site was recently upgraded so it is much easier for me to respond quickly these days. Thanks for reading and trade well.
-Steve


