KISS (Keep It Simple Stupid) is an old expression that, in a nutshell, says: the cleaner, the better. I'm sure many of you are well familiarized with it by now. And don't we all love simplicity? Of course we do. There is a certain elegance in keeping our lives, trading systems, or just about anything we do on a manageable level that makes sense.
But many people subconsciously like this expression for another reason: one way of interpreting it gives the reader a “free pass” to feel as though they don't have to dig too deep to be successful at something. Obviously, that's not the original intent, and indeed these days it tends to be used as more of a marketing slang than anything else.
Anytime I hear this expression in relation to trading one thought comes to mind: Don't Keep It TOO Simple, Stupid.
Because look at all the pinpoint opportunity or just realizations that your strategy might be defunct, that you miss. If stress in trading is your problem, then leverage or a lack of understanding of market movements is your issue, or both. But understanding these details is highly relevant and should not be overlooked.
I recently Googled the expression and came to a popular retail FX trading website. KISS is “marketed” there and naturally, the number of things this author is missing on his charts is nothing short of mind blowing. And then there are slews of articles talking about conquering stress, etc., which I get, but I have to ask this: If he understood why and when price is turning, would he feel the need to conquer as much “stress”? Probably not. Instead of talking about stress why not figure out what's happening in front of you? That, to me, makes a lot more sense. Put me in a pitch black room and I'm stressed. Put me in front of chart I dont understand and the same thing happens. Just get to the bottom of the issue at hand.
Nitty Gritty Benefits
There are tons of benefits to knowing just the information we've discussed over the past few weeks alone. If any beginner just started here and worked their way forward, things would indeed be much more clear for the path ahead. Personal development will always be required, however, and that's not something that can ever be skirted.
Most traders pick away at countertrend moves. And when I say pick, I mean PICK. A little here, a little there, and before they realize it they've got little red smears that add up to one huge smear in their account at the end of the week. I've talked to more than enough people to know this isn't a rare occurrence and indeed I used suffer from a similar affliction at one point.
I still “pick” intraday, but there's a massive difference in what I do now versus 8 or so years ago, and that's control. I'm now just much more aware of when price is going to make a move, how it's going to do it, and what I need to do to take advantage of it. There's nothing psychological here. I didn't gain more discipline or do anything else on a bullet-point checklist. It's just know-how. I can read charts like a foreign language So if you ask me if people can be taught my quick answer is “yes”.
But you have to take the time to do it. And you have to look at the nitty gritty. When you look at a price chart in one macro, sweeping movement, that's fine, but at some point you're going to get confused. There will always be times when things aren't clear, no matter how advanced you are. But minimizing those times to exist as little and inconsequentially as possible is what you're doing when you learn. These little things that we're discussing here these past few weeks are turning points….and they're all derived from trend lines. Nothing fancy about that, but extremely relevant.
Last week's article about trend trading was popular among regular readers, and I can only guess why: as I said in the article itself, trend trading is extremely difficult to do, and much of this is based on our early notions of trading (buy low sell high). As simple as it seems, it is far from easy to accomplish.
Today I just want to highlight a couple more simple yet relevant things that might help in the identification of these adaptive turning points. Once again, as I'm quick to point out, showing everything after-the-fact is a piece of cake. But when you're in the heat of the moment and decisions need to be made, you have to know how to approach this from a forward-looking perspective. And you certainly will, over time, if you aren't already and are looking at the proper things. This will be the last discussion about these trend lines for a little while so we can get back to measured movements and other pinpoint execution techniques.
What Everyone Needs to Know About Trendlines
So before we get too far, I want to cover one very important underlying theme about trend lines: one of the first things I learned about them is that price accelerates towards them. And many times, the closer it gets, the faster it goes, only to hit it, and reverse. Breakouts are simply much less likely than fades.
To put it in the utmost form of common sense, think of it this way:
1. It takes a minimum of 2 highs or lows for you to be able to draw a line on your chart.
2. The third one tends to fade, and 4, 5, 6 etc. fades are possible, but
3. there can be only 1 breakout.
Which means for every trendline (with any significance) on your chart, you've got a minimum 2 to 1 ratio of a fade versus breakout on any standard diagonal or horizontal trendline. The norm is 3 to 1 and of course that number can be greater. And any trendline with only two hits is generally insignificant in terms of a breakout, because there is just no strength to the line.
Breakouts are just that unlikely, using this very common sense-based definition. And when they DO break, their relevance is heightened. So now that we know this, leverage is attained, and can categorize trades taken from trendlines in two major categories:
1. Prior to breakout (fades), or
2. Post breakout.
Let's take this step by step and cover these in order:
Scenario 1: Prior to a breakout (fading the trendline)
The most common means of drawing diagonal trendlienes are UNDERNEATH price in a demand scenario and ABOVE price in a supply scenario. While from a birds eye perspective, this is an easy way to identify a trend, pinpointing execution from these lines can be a very big challenge. Questions arise, like:
“How do I know I'm drawing this trend line the right way” or
“How do I know if this is even going hold?”
It's downright difficult to take trades of of these levels, as we well know. Simply stated: price gets “messy” around these trendlines. Blame it on the amateurs. You can confirm with bar patterns of course, or retests on smaller trend lines once broken. But as far as that actual highest or lowest price is concerned, alternative means are needed.
For exact trend line fades (direct hit reversals), I generally prefer using demand lines drawn ABOVE price and supply lines drawn BELOW price. These are for countertrend trades. I just find much better execution doing it this way as opposed to the latter.
Also very important, let's go back to the major rule when it comes to trend lines:
You need 2 points to create it. The third one tends to fade, contingent on the circumstance. This is consistent with our triple tap pattern, which shows up all over your charts, every day, all day long long around reversal points. It is also true on larger timeframes. Here is a recent example (EUR/JPY) of everything I just talked about:
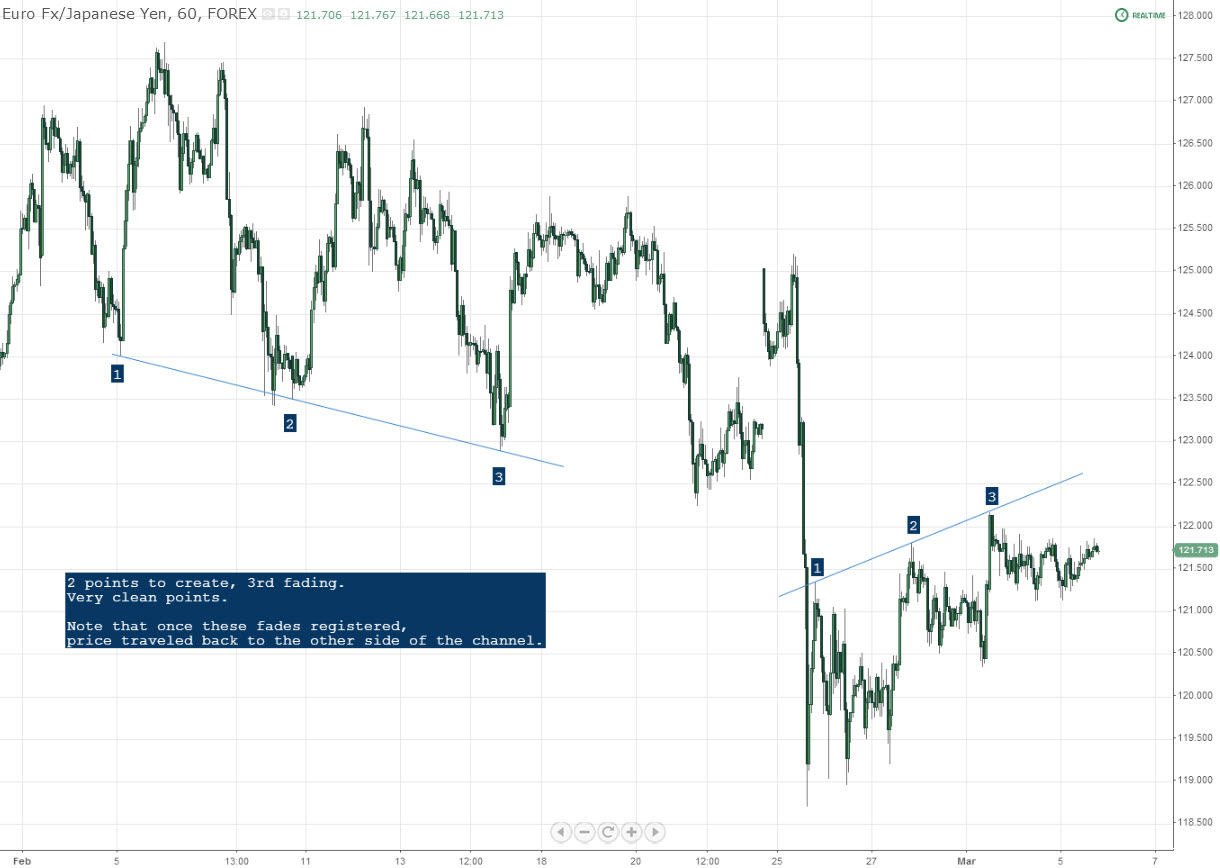
These aren't exactly small moves, either. Depending on the context, larger timeframes tend to respect these much better than their smaller counterparts. One of our readers actually sent me the first trade via Twitter – thanks for shooting it over – you know who you are.
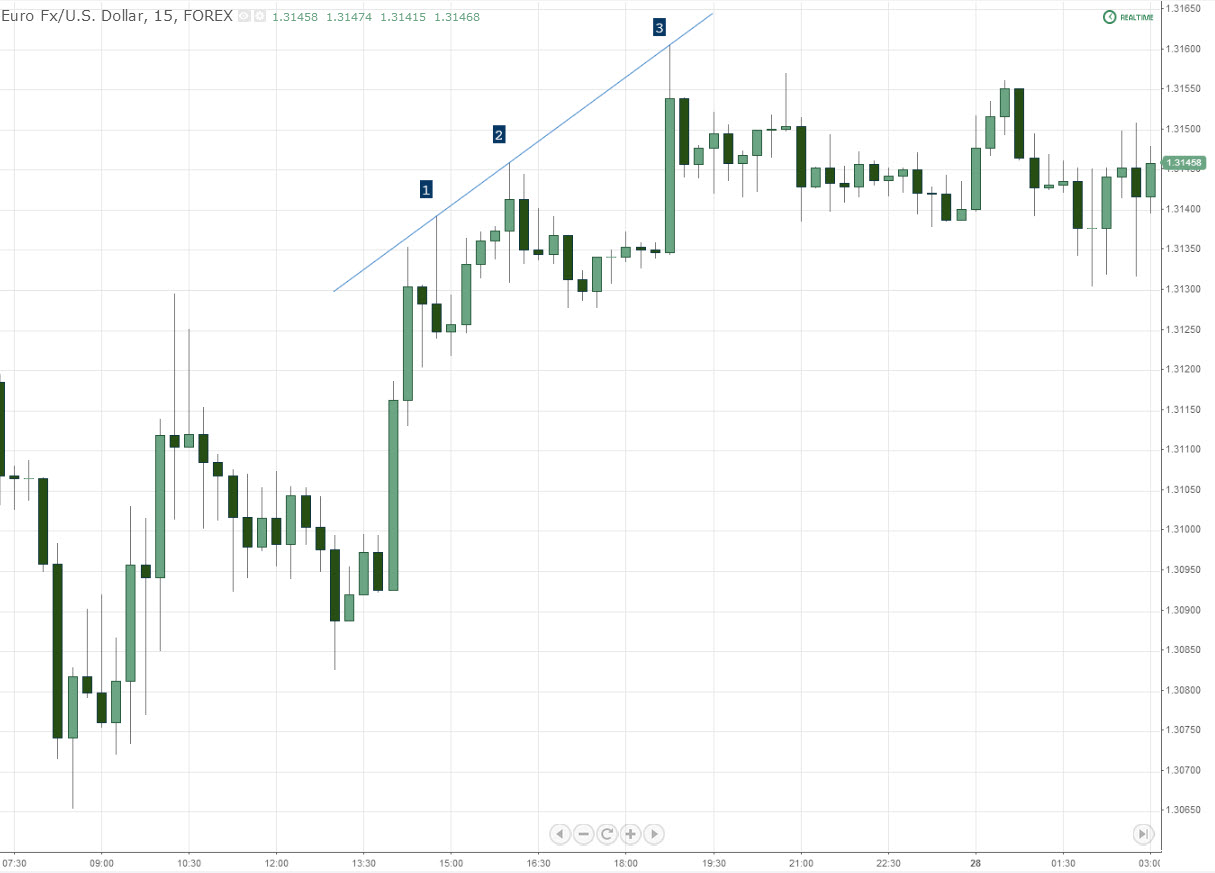
Here's one more, this time on a 15 min chart:

And another one:
NBT experts know that we have now entered triple tap territory. How often do highs and lows coincide with 3 pushes? Let's take a very gratuitous look at this:
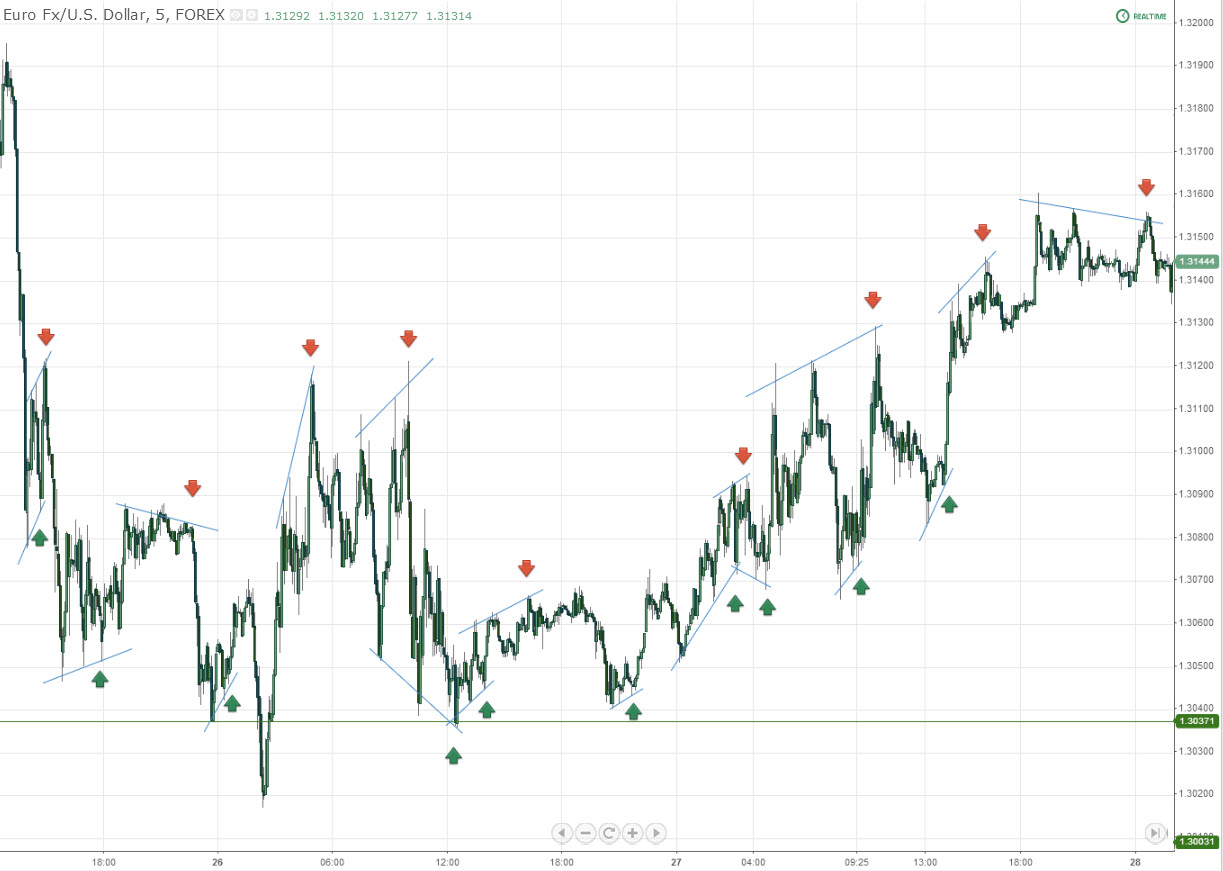
Yowsers. Maybe trading IS as easy as 1-2-3? No, it's not. Pretend I'm your crazy, disgruntled uncle, generally pissed at the world and here to destroy your dreams. We still need a top down approach when it comes to execution. But that's another blog post.
Regardless, you can see from our last chart that we've got one exception to what I stated above, and that's near-term ascending and descending demand and supply lines, respectively (in line with conventional wisdom, but on a short-term basis). When they happen so close to one another, the amateurs miss the boat most of the time, and you can see you've got a power play working to your advantage. So if you miss the dead-bottom then you can still hang in there for a third push. These are small and detailed though, so just a word of caution. Safe to say I'll make another full post about these, because they're extremely valuable.
And once again, I realize my words alone can be cluttered here. But I'm talking about these:
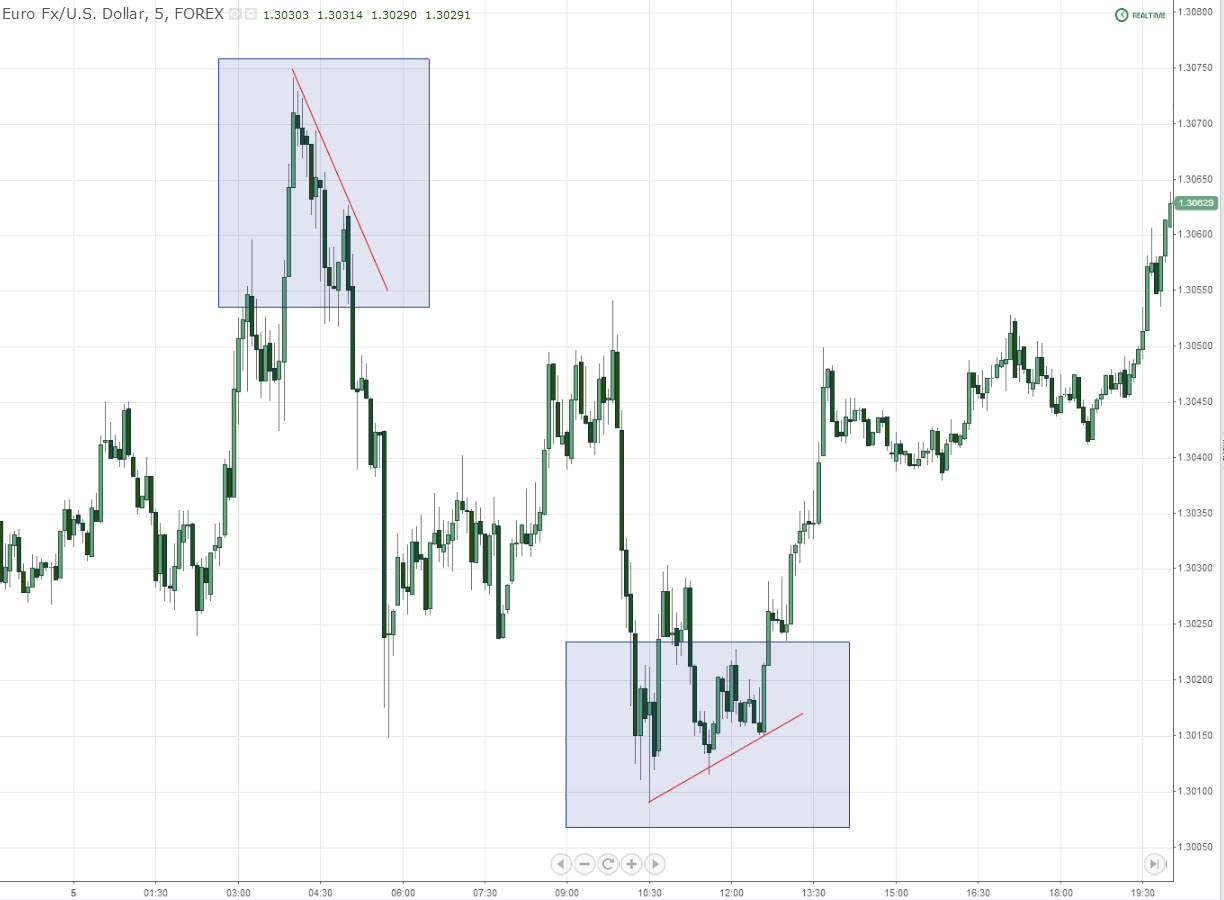
And this is all happening in a range. Seeing these within (and in the direction of) a trend can pay off much better, of course.
Scenario 2: Post breakout (trendline retests)
Indeed, you don't even have to go after those massive countertrend trades to turn a profit. It all depends on your preferred skill set. Waiting for trendline breaks has a lot of value:
1. The market has just “confirmed” something. A backward retest on the trendline seals the deal.
2. You can just easily derive a reasonable take profit, to another trendline or to a measured move.
3. The deeper the break, the deeper the move. Good reward to risk is still present.
But of course you need to be looking at the proper trendlines. Peripheral, or outer trendlines, don't give us the value that the ones taking heavy hits inside the previous range do. And these lines tend to respond “to the pip” much more than their counterparts, depending on the situation.
When trend lines get used 3, 4, or 5 times they build significance. The more reoccurring hits you get on these lines the “stronger” they become. They become “stronger” simply because they gain celebrity status – more people can now see them and are likely to use them again once broken.
So using an admittedly terrible analogy, you want to find the A-listers on your chart. Which trendline is Tom Cruise and which one is a busted up reality TV contestant? Find the confluence. You want to find the Tom Cruise of trend lines.
Tom Cruise might be short, but he knows how to fork in the cash. Same goes for your little trendlines.
We're going to apply a couple rules of thumb that truly help out your trend trading. If you haven't read last week's article. Please stop here, read it, and come back. This won't likely make as much sense to you otherwise.
Let's take another look at one of last week's charts. These ranges will vary of course, but the premise always remains the same.
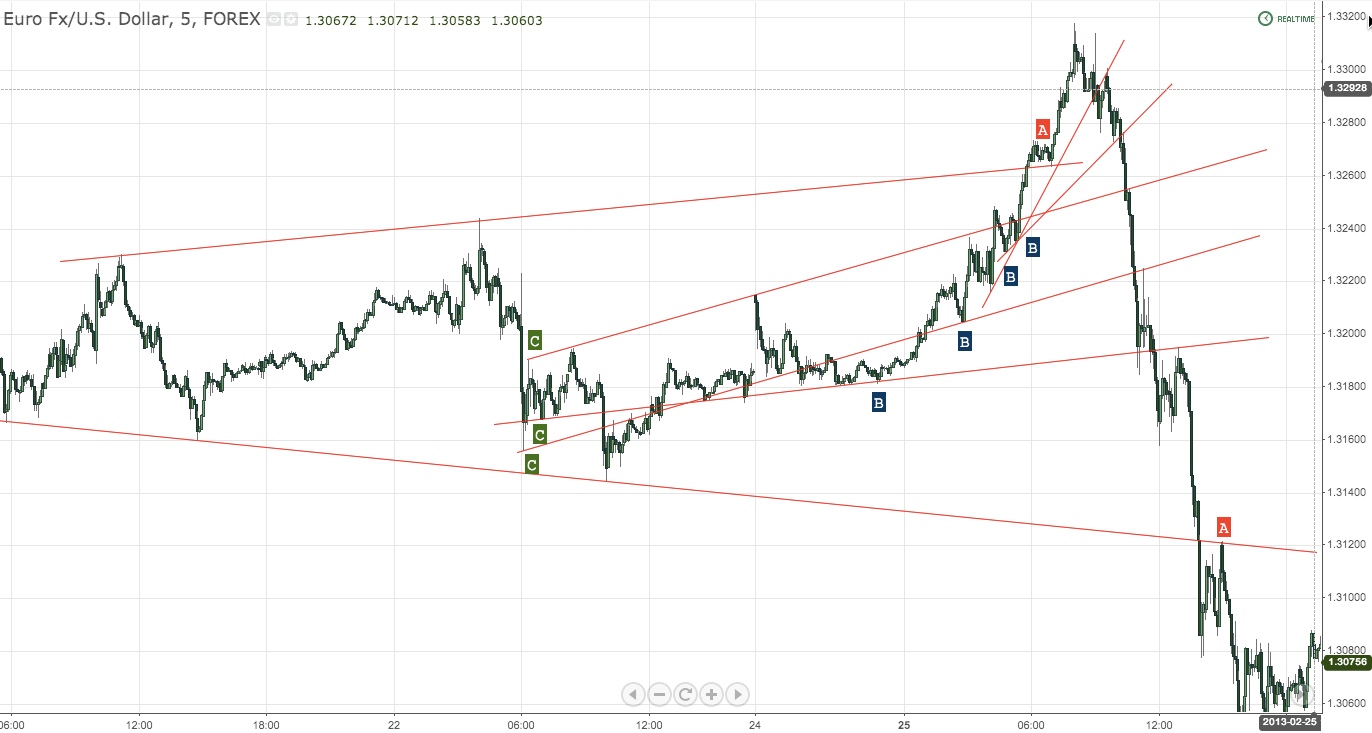
Let's start with what happens when price is trading outside of the range: upper and lower trendlines are used for retests to take price higher and lower (Points A)
When we are inside a trading range, prices are relatively neutral. They are neither “overbought” or “oversold”.
But when we leave a trading range, a trend is created, no matter how short-lived it might be. While most indicators are showing overbought or oversold, day traders are just going to keep buying or selling. It is that simple. Typically not until these indicators diverge or more relevant objectives are met do we start to see the masses back off. Look for retests on near-term trendlines to confirm this.
Next, when price starts cascading through our traditional trendlines, those holding confluence are used on the back end for retests.
Points B are labeled to demonstrate that at least one touch was derived from the previous move higher.
Points C demonstrate that when possible, trendlines will go back towards the middle of the range. In the case of the first two to get used, this wasn't possible because of their angles.
Also worth noting (and was mentioned last week), when price got towards the center of the previous range, pullbacks became deeper. This is short term profit taking and intraday longs stepping in after a decently sized drop. After the slowdown, we raced to the next trendline.
DKITSS = Don't Keep It Too Simple, Stupid
So back to the beginning of this post. And here is where we want to keep it simple, but not too simple.
Simplicity is in our trendlines. There is a short, mechanical process that your brain is going to go through if you're trading from these things. You are:
1. Finding a level of opportunity
2. Waiting for a reaction
3. Letting enough time go by for a reasonable pullback.
4. Possibly confirming with individual bar patterns.
5. Setting a reasonable take profit based on another trendline or measured move / any other technique that holds integrity.
6. Setting a reasonable stop loss based on the potential yield of the trade.
Sometimes you won't “see” the retest until after it happens. Which is fine. You still have means of getting into the move after that initial shove. Work on getting in AFTER the confirmation. Just become comfortable with this process. In the coming week's we'll break this process down a bit more.
There are many other means of using these trendlines to your advantage, of course. My goal recently has been to just outline some of the major uses so you can (if you feel you have been) stop looking at charts that simply don't make sense. Musicians read music, chartists read charts. All these moves are deliberate, driven by something. I want to show what that “something” is.
While I don't expect most people to instantaneously take this information and transform their process overnight, it is just as important to show how and why price is behaving in certain ways. This knowledge alone is tremendously helpful, whether or not it is used to trade from directly.
But it can be, of course, and all the better as far as I'm concerned. While I don't feel the need to explain it, hopefully you can see how everything we've been discussing these days allows you to have a much better heads up on price action in general.
So here's to being enlightened. Thanks as usual for stopping by and see you soon.
Steve
Chart Sources: http://www.tradingview.com
———————————
Please help support for our free site by sharing our articles with friends and colleagues. Every visit helps us out tremendously and we strongly appreciate your efforts.


