Today I decided to write about something that rarely gets attention, although is easily classified as one of the major killers for both discretionary and systematic strategies. “V” tops and bottoms of course occur in any market, and are simply sharp reversals in which price accelerates into a level, and then abruptly fades it.
Because this market is so highly prone to both high quantities of pending orders and quantitative strategies in which high volume moves are quickly traded, V tops and bottoms can be common occurrences. I recently showed an energy trading friend of mine a simple 1-min EUR/USD chart, and I was a bit taken aback by his immediate comment. He said it looked “digital”, meaning that range reversals appeared sharp and more or less not created by your average Joe traders.
My response was something along the lines of: “Well, that's because it is. Don't you know that SkyNet controls these markets now?”. And there is truth, of course, to this statement but one thing we all know: these sharp reversals can be the friends of few. But they do happen, and we should know how to manage them at their inception.
Step 1: Know the drivers
The majority of V tops and bottoms are caused by one of two things. Knowing this alone will have you on alert and better prepared in the event that one were to occur. They are usually accompanied by either:
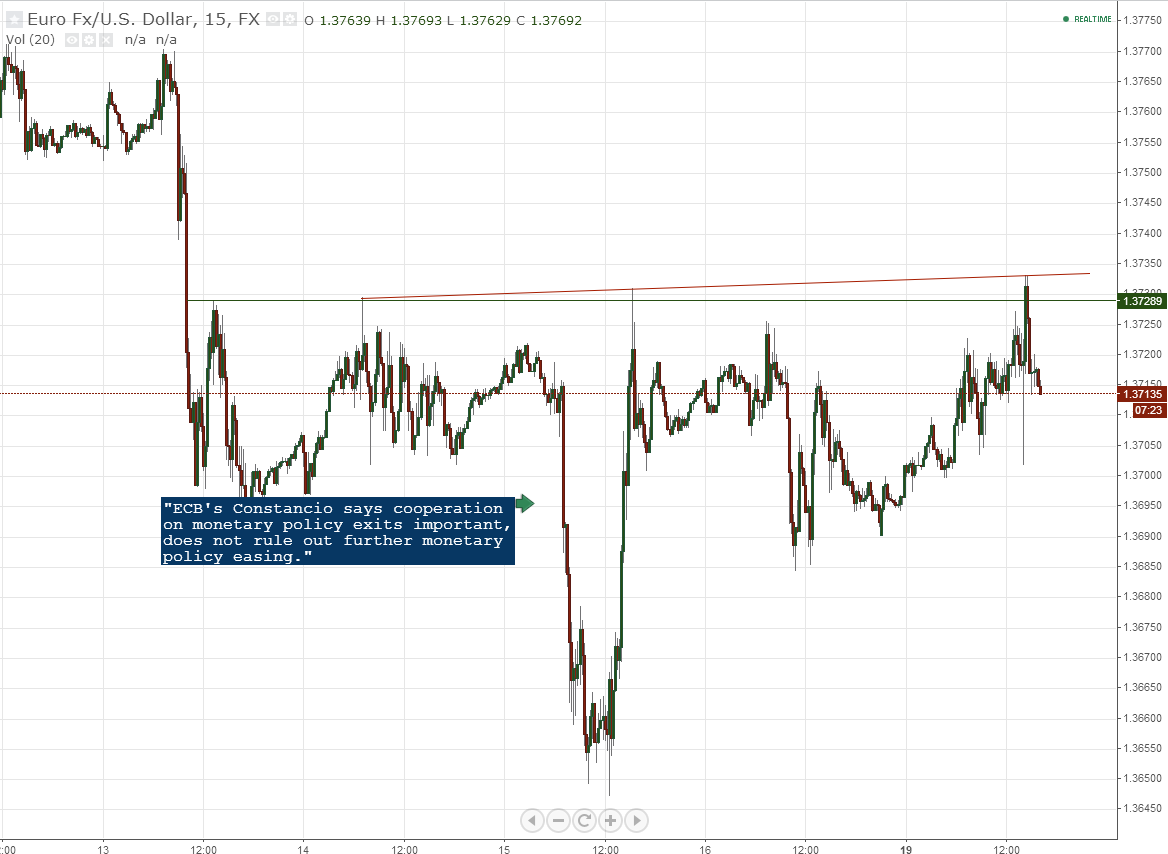
1. News / data of some form, in which the market shows an initial interpretation, which is quickly forfeited for the longer-term one. We see this a lot in the FX market when a high ranking government official says something that is quickly traded, only to be digested, with the initial reaction later being faded.
We saw this happen just last week when the ECB's Constancio came out and essentially confirmed what was already known by market participants. Earlier in the week, ECB President Draghi stated the same, and the downfall of EUR/USD ensued. Being already “priced in”, one could classify this as an exaggerated movement, thus soon thereafter, fading.
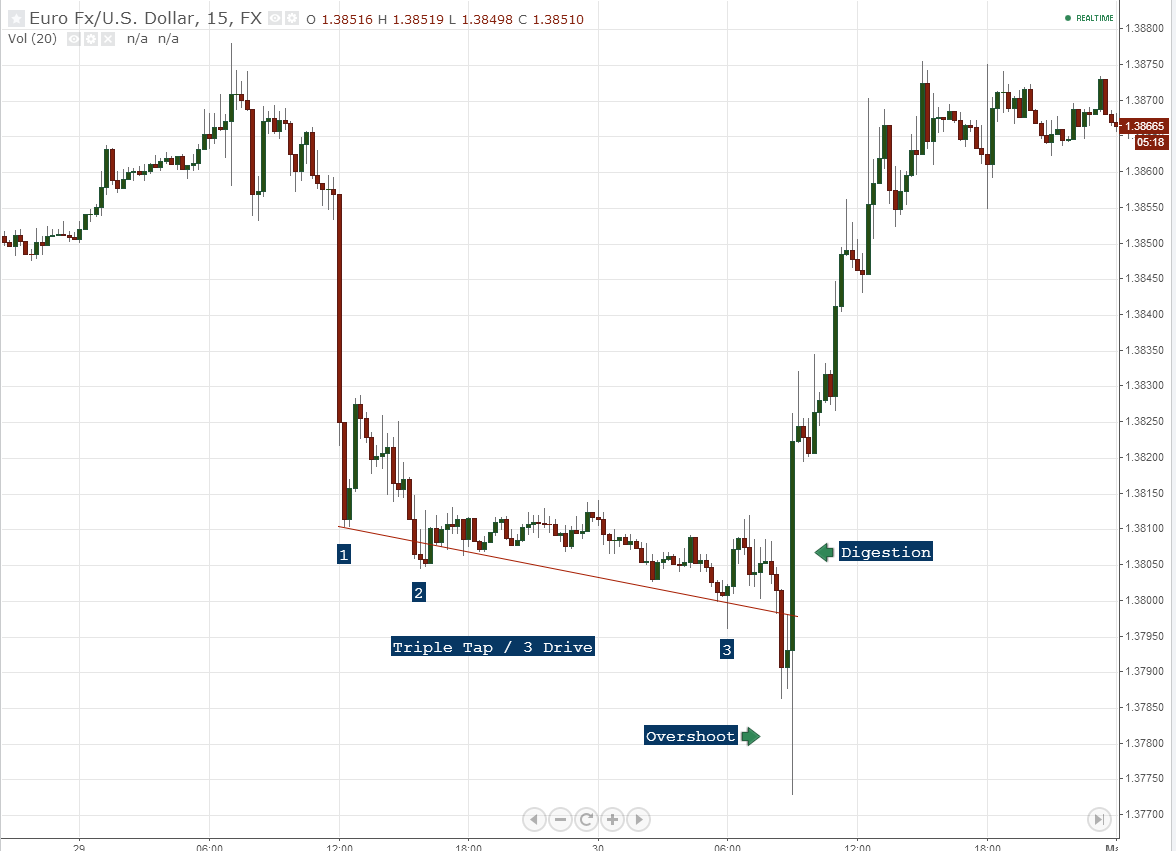
2. Exaggerated movements in price, in which overshoot is present. A V top or bottom closes the “gap” from which the overshoot originated. In this instance, a common topping or bottoming structure is busted, only for price to race even further, and quickly. These can usually be measured to find a base using any of our common measured movement themes. The example below highlights action on our last NFP announcement, which no doubt surprised more than a handful of traders.
There are other primary drivers for these of course, with the flash crash immediately coming to my mind, albeit rare as they are. Most of them, however, can be classified into one of the two groups listed above.
Step 2. Know the anatomy
V tops and bottoms are just like any other reversal, with 2 distinct characteristics:
1. They occur in less time
2. Pullbacks are shallow.
….hence giving to the name itself. The major weakness of traders when it comes to dealing with these is the immediate momentum. After seeing that price is moving aggressively in one direction, it can be difficult to switch gears into thinking that it will fully reverse and eat up all of the previous gains / losses.
V tops and bottoms are usually nothing more than exhaustion gaps. Those of you that have been following this site for some time may or may not be accustomed to my term “liquidity gaps”, which you can find more about here: https://paracurve.com/2011/05/liquidity-gaps-and-spike-removals.html .
The term “exhaustion gap” is far from new, and describes price “exhausting” after a gap is created. Our “gap”, in this instance, is the overshoot. And when the overshoot fills in the case of an exhaustion gap, there is no fade. Price simply keeps on moving past it, as shown in the examples above. This is a relatively constant matter, and I strongly advise against fading the origins of these in any circumstance.
V tops and bottoms also tend to respect traditional support and resistance lines / order clouds. Quite literally the same rules apply with these reversal points as they do with any other; price just gets there a whole lot faster.
Step 3. Find your reversal point
Amateur traders tend to love volatility for obvious reasons, which we won't get into now. Reacting quickly enough to come up with a lower tiered target is a very difficult task, though required. It should be the first thing you do. Without knowing this, you are essentially rolling the dice trading of these on a discretionary basis because you simply won't have backup conviction otherwise.
Moreover, these movements will tend to happen abruptly and in fast form. Latching onto the initial movement is simply not easy unless you are quick enough to find an obvious point of propulsion. Again, prior to making any attempt to latch onto one of these, know this level, and ensure it is a rational one.
Step 4. A Few General Rules About Fast Markets
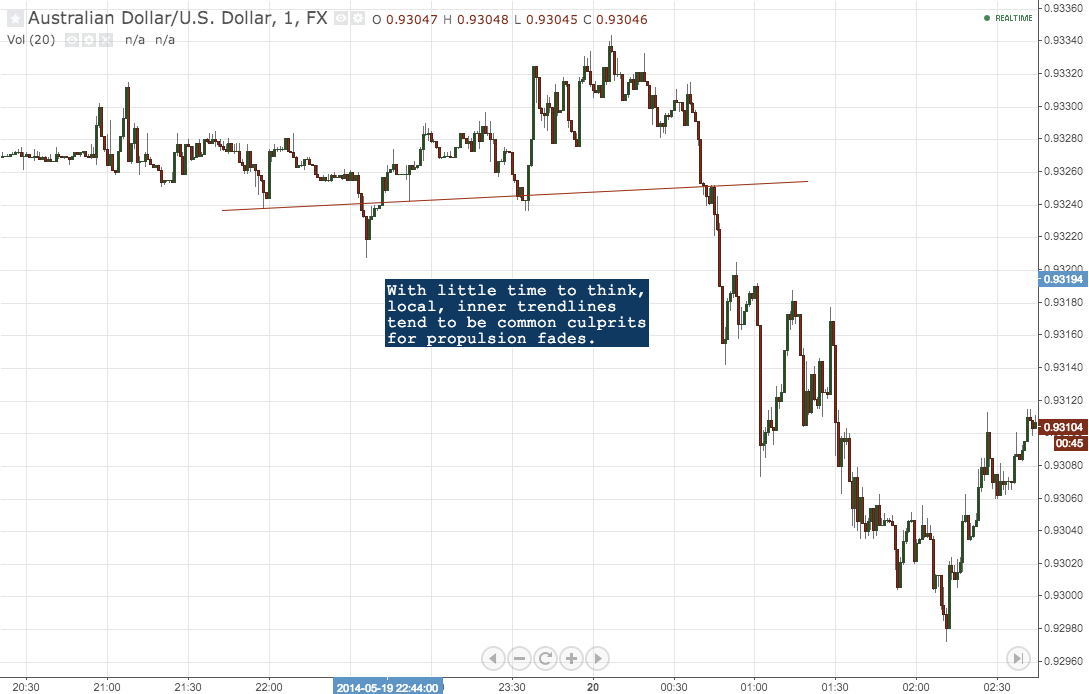
Support and resistance levels that tend to get respected in faster markets are usually found locally and easier to identify. I would think this is due to nothing more than the fact that traders simply don't have the time to go digging for much more and use local levels in order to enter positions that go with the flow.
I have more or less gotten used to the fact that once volatility begins to settle in, I start looking for support or resistance in local ranges. It is more of an issue of practicality for me than anything else.
Trading volatility means larger movements in a shorter window of time. As with any fast market, drilling down to a lower timeframe with give you the type of detail normally seen on a higher timeframe. This can also translate to more risk for traders so adjust accordingly.
Step 5. Be prepared to trade momentum.
This is no doubt one of the more difficult steps for anyone to get used to. Those that do this, and do it well, are usually the ones that end up making more money and in general, a little more highly coveted. Trading into momentum after a reversal has already occurred is something I highly, highly encourage anyone reading this to get used to.
Trading is much more than finding an entry point, as I rant about all the time on this site. It is all about being able to forecast a chunk of price action and trade it accordingly. A reversal isn't a full reversal until the macro trendline has broken. In the case of V tops and bottoms, these macro trendlines are very parabolic. And as I mentioned earlier, do tend to be respected, but you will need a smaller timeframe to find them.
I am not a fan of 1 minute charts unless I am trading something that absolutely requires it, such as volatility. The more macro I can be as daytrader, as far as I have always seen it, the better.


