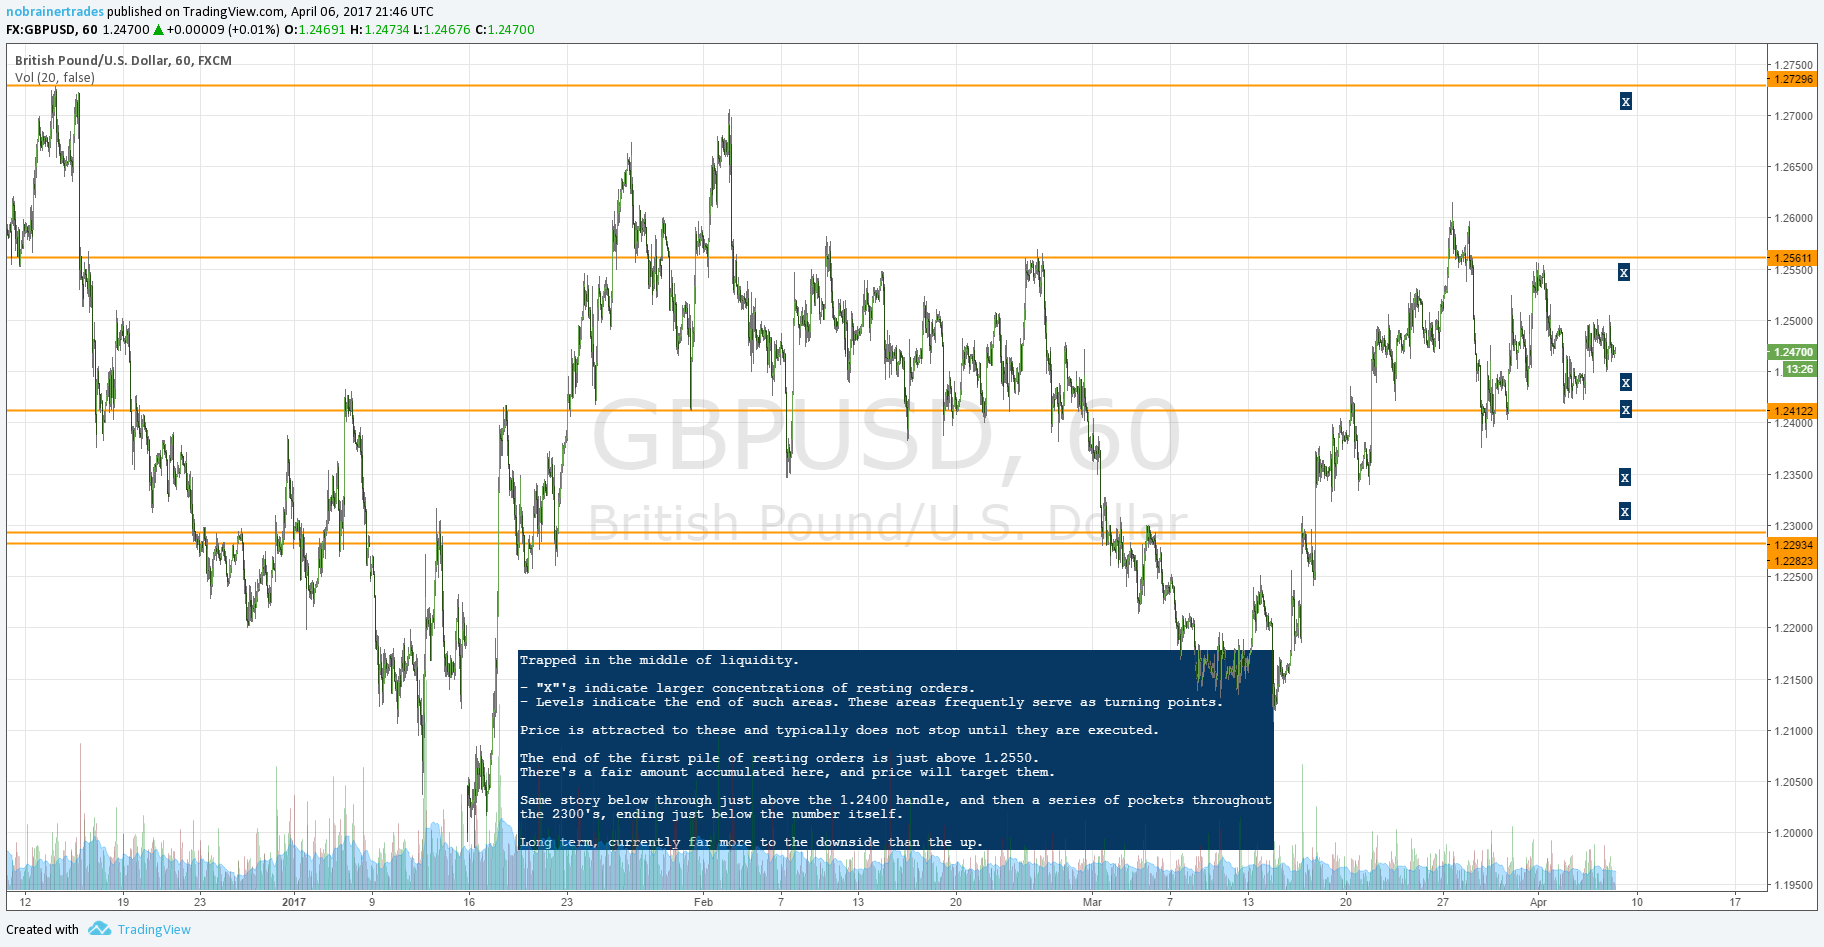
I posted a similar chart to Twitter/FB yesterday for EUR/USD. Here is today's for GBP/USD with better explanations on the chart. Regardless of the instrument, you would seek to trade into these areas and potentially fade when they're sufficiently traded through and resting liquidity is executed.
It goes without saying that these are volume-based, thus “expire” just about every day. Longer term levels tend to remain the same but require regular review.
How are you determining the areas where resting liq is sitting Steve? Levels are PA based I assume, but the Xs?
2 places: TenFore feed through IQ Feed (just open a DOM panel) and plain old oanda retail online order book, which basically mimics most institutional data in terms of location but obviously not everything that follows, which we would have no idea. Resting orders use the same principles of executed order flow (if not better) for basic acceptance/rejection principles.
Hi Steve. Do you look simply at the netto orders?
Some levels have high order volume on the buy and sell side but netto they negate themselves out. So I wonder if those levels are important too or only those which have a clear overhang on one side.
Guess I just found the answer myself in an older article from you here 🙂
https://paracurve.com/2012/05/interpreting-touted-order-flows-results-of-a-long-observational-period.html
Well at the time that might have been more applicable. I honestly look at that data nowadays as outright dangerous because you just can’t see it with your own eyes. Basically these follow the same rules as any volume profile distribution, where voids deflect and large pockets accept. I send a lot of people to this article because it cuts to the chase in terms of what all this means overall: http://traderkingdom.com/technical-analysis/trading-acceptance-and-rejection-with-market-volume-profile/
The obvious difference is that you’re doing it with resting order flow and not executed.