Most people seem to have become complacent and accepting of the nature of the FX market over the past couple decades. Its already massive size in terms of turnover, for obvious reasons, and outright ludicrous growth have done nothing but accelerate at warp speed during this time.
So naturally, it came as a shock when The Bank for International Settlements released their Triennial Central Bank Survey last week, and saw that “growth” (at least in the spot transaction world) is now a thing of the past.
From 2001 to 2013, spot transactions exploded from $386 billion to $2 trillion. This is the kind of growth you would expect to see from an anomalous company, and is a testament to how rapidly things have changed over the course of our lives.
That's 530% growth over 12 years. So when 20% of the triennial peak (or 106% of the '01-'13 growth) gets stripped away over a 3 year period, it is going to turn a few heads.
Spot FX transaction turnover dropped from $2.046 trillion in 2013 to $1.654 trillion in 2016. That's a difference of $392 billion.
The other significant downtick in the report (in terms of a %) came from “FX options and other products”, which sank to $254 billion from $337 billion three years ago. Exchange-traded futures and options are in a similar boat.
The reasons for the slowdown are the source of educated speculation, most of which stem from regulatory clampdowns on the global level as well as a change in commercial hedging activity. Let's not forget also, that this is an industry which has been moving forward at the speed of light as technology has made everything more and more accessible. We have hit a plateau as far as a lot of that is concerned (no material technological changes for the past several years) and like anything else, the “new car smell” tends to wear off.
The Sources
The BIS recently started tracking data by counterparty, shedding some (but still broad) light on the sources.
By far, the “other financial institutions” category had the most impact on the dip. This group includes hedge funds and proprietary trading firms, investment banks and securities houses, mutual funds, pension funds, leasing and insurance companies, etc.. Private hedge funds and PTFs were responsible for approximately 1/5 of this change on their own.
The two instruments taking the hit are also the ones used heavily by speculators. Here in the United States, Dodd-Frank has essentially consolidated many financial business types while attempting to separate those posing conflicts of interest on a management / speculative level. I sifted through the Act heavily when it passed, as part of my responsibilities included overseeing compliance at the time. To this day, there are items stated in The Act that are not regularly enforced by either the CFTC and SEC.
Simply put, it takes time for any regulating bodies and the rest of the industry to adapt to new legislation. Regardless, the most pertinent parts of the Act had a trickle down effect which significantly slowed or stopped the efforts of proprietary trading efforts at banks, while the sheer interest in speculative FX has waned at hedge funds, which I can easily nod my head to from experience.
So if FX spot transactions have taken a nosedive, why haven't other instruments? We can do all but look at the people trading them, as well as their motives. Where spot FX is heavily susceptible to swings in volume driven by speculative activity, this is less so for forwards and swaps, which are used for a range of other purposes, but primarily inclusive of hedges on foreign transactions.
These two groups have remained relatively consistent in volume over the past three years, upticking only slightly.
They are also institutional grade instruments for the most part. Swaps are used heavily for hedging among financial institutions, who comprise the largest segment of their use, and large, multinational corporates.
We can assess that any swap turnover (which contain FX spot and forward transactions) is already being reflected in the numbers. Long term, as they have risen, so has everything else. Just like a toddler being able to use an iPad while the senior citizen can't send an email, swaps are much more commonly understood, thus popular, nowadays than they were even 10 years ago.
The safest assumption here is that among the decline in spot transactions, we have a combination of regulatory pressures, decline in speculative activities, and more sophisticated means of hedging available.
The Most Actively Traded Currency Pairs:
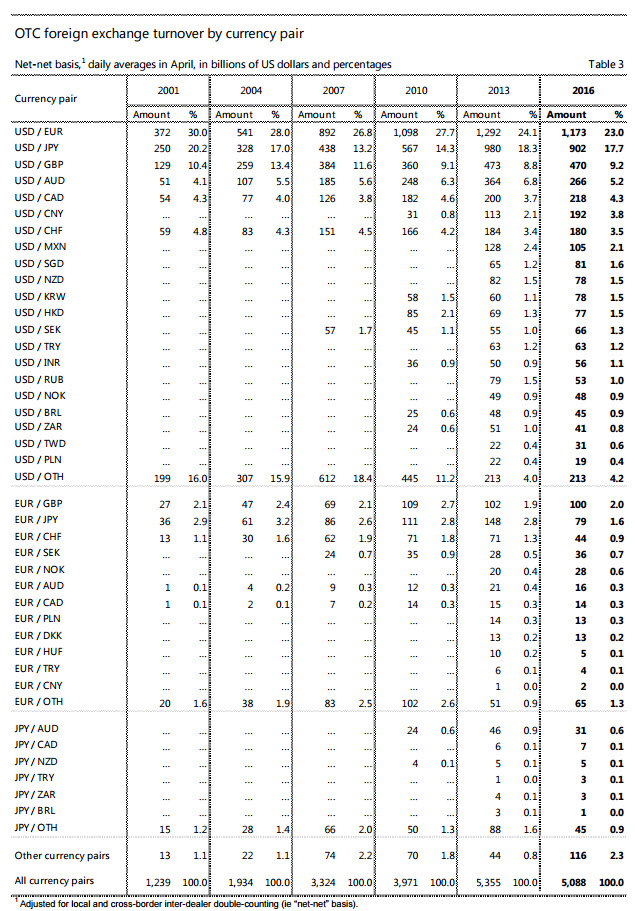
This is a chart which we are used to seeing few changes with from the perspective of a % of total share.
EUR/USD downticked slightly, now making up 23% of all transactions, followed by:
USD/JPY (17.7%),
GBP/USD (9.2%),
AUD/USD (5.2%),
USD/CAD (4.3%),
USD/CNY (3.8%), and
USD/CHF (3.5%).
Of the crosses, worth noting and in top-to -bottom order are:
EUR/GBP (2.0%),
EUR/JPY (1.6%),
EUR/CHF (0.9%),
EUR/SEK (0.7%), and
EUR/NOK (0.6%).
Full details:
 When we look at overall currency distribution, by far the biggest climber since 2001 has been CNY (then ranked 35). It is now the world's 8th most popular currency.
The Mexican Peso (ranked 14 in 2001 to 10 in 2016) and Kiwi Dollar (ranked 16 in 2001 to 11 in 2016) have also risen in popularity, though not nearly to the strength of the Chinese Yuan.
The Euro and the Yen have dropped 2.1% and 1.5% respectively, while the British Pound gained 1%.
Location, Location, Location
The source of these drops in spot turnover is just as interesting.
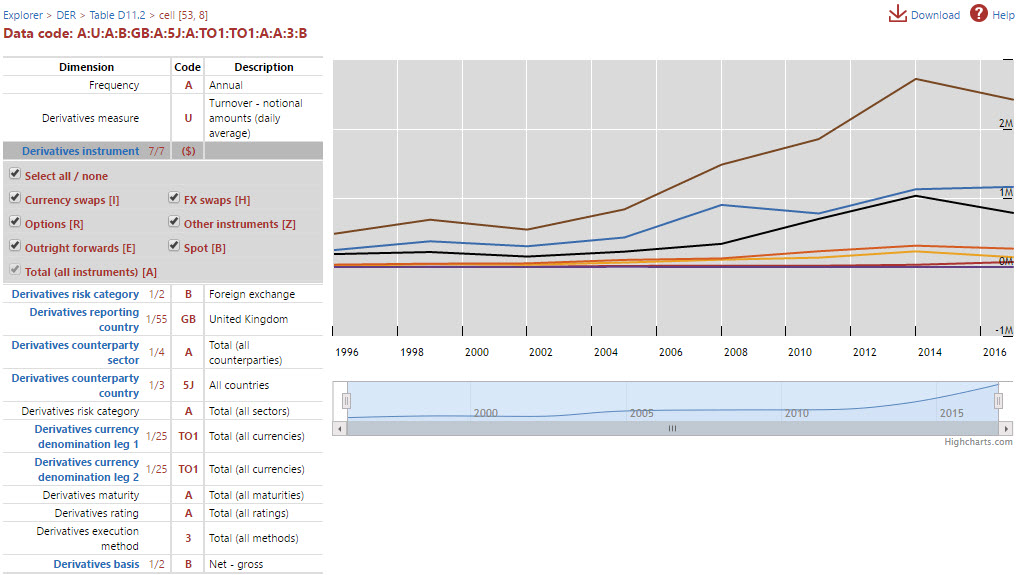
The U.K. continues to dwarf everybody else when it comes to total OTC FX turnover, but from 2013 to 2016, the total dropped from $2.73 trillion to $2.43 trillion.
The chart below breaks down this turnover by instrument:
So no surprises here in the sense that the two categories taking a significant hit were spot FX (black line) and FX options (yellow line). Outright forwards also dropped, albeit not to the degree as the other two. Forwards, which are academically viewed as a hedging instrument, are also packed in a number of trading strategies and easily grabbed “off the shelf”.
The U.S. is #2, as it has been for many years now. What's different about the U.S.'s data is that total turnover actually increased over the past three years. Obviously this seems to break the trend, but not until you dig down into the data:
Once again, FX spot starts to sink the ship, which is this time saved by a significant uptick in swaps.
For the rest of the word, the U.K. data is the most common mirror, with Hong Kong, Singapore and Japan coming in 3rd, 4th and 5th respectively in terms of total turnover.
See the same for all other countries surveyed here: http://stats.bis.org/statx/srs/table/d11.2
If I can speculate were this is going to go, “sideways” seems to be the best word at the moment. The world is only getting bigger and inflation will always be a factor. But would probably be a fool in saying something like “regulation seems to have gone as far as it can possibly go” because as we all know, laws are much more easily applied than they are taken away. Whether or not this is going to have a material impact going forward is yet to be seen, but I do think this is nothing more than a stabilization of an aggressive trend.
Primary Sources:
Bank for International Settlements Triennial Central Bank Survey, Foreign Exchange Turnover in April 2016: https://www.bis.org/publ/rpfx16.htm
Bank for International Settlements Statistics Explorer D11.1, D11.2, D11.3: http://stats.bis.org/statx/toc/DER.html


