- We present a new variation of measuring price objectives, based on the initial drive in price (or range) following a reversal.
- May be used as a meter for taking profits, staying out of the market until a full cycle has completed, or simply gauging short term exhaustion in a range.
- This means of measurement is not effective on spikes, although we have a separate means of measuring them.
- The standard extension measurements are used. Similarities are seen between other measured move principles, although not in such complicated manners, as we only use the first movement.
So we are back with another installment on our measured move series, and this one could no doubt help a good majority. This particular variation is specifically effective in price ranges, where whipsaw activity is the norm and questions arise over which support and resistance levels are going to hold validity. I primarily use them as profit targets, but they are equally effective in determining whether or not a new position should even be considered, as they compensate for the “wiggle room” required in any normal trading day or range. I stress, however, that they need to be used as a descriptive area in which we expect price to react. Anything beyond that (such as seeing them as clear as a bell buy or sell “signals”) and you could find yourself in an egregious situation. Context is key, as with everything we do.
All too often, traders will attempt to go long or short when the market has not yet completed its “standard” move. And that scenario tends to be where these assist the most. These are based solely on local activity, thus, they can compensate for individual trading sessions as well as spikes driven by economic data or serve any other slew of purposes.
Before I get too far, I have to say that there are countless ways in which measured moves can occur. I have made it a priority to get the ones listed up here that 1. I find the most effective and 2. show a high level of consistency across a very wide range of markets and individual instruments.
As is the norm and I have explained in the past, when it comes to measured moves, you have to think in terms of trade entry to completion. The market is continuously evolving and for the purposes of any trader's objective, you simply need to determine what a reasonable movement would be. Reasonable moves, as far as we are concerned, are full, round circle transitions. Without a reasonable move, you either 1. don't exit a trade or 2. put on any new counter exposure. So here we go:
The Concept (using long trades as an example)
1. Price creates a new low, and retraces higher.
2. It then pulls back lower again, creating a “flag-like” range.
3. Your upside target is a measurement of the intial drive.
We have one notable exception to these norms and that involves spikes. But we of course have our own means of measuring those, as explained here. I will talk more about those a little later.
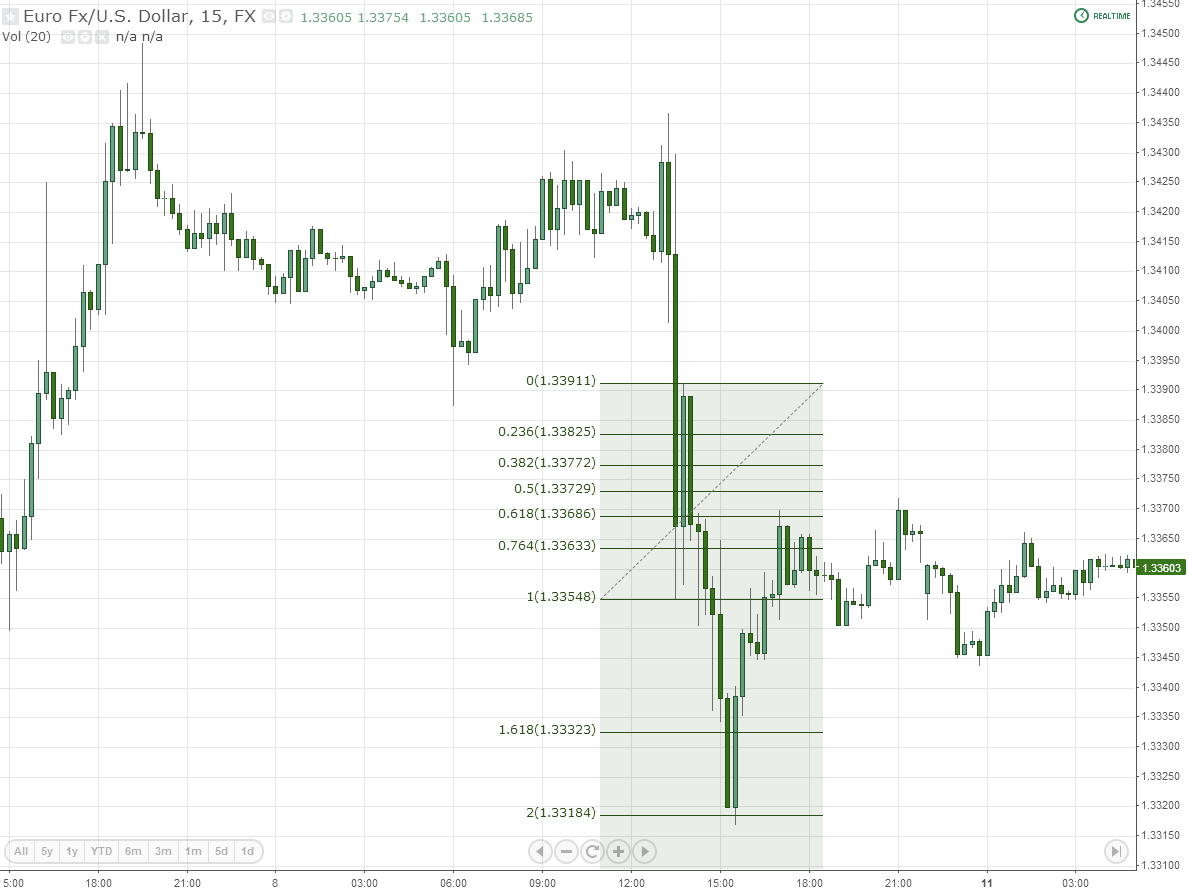
Firstly, let's take a look at EUR/USD's recent price range and show, literally, every instance of these occurring. The only omittances are the two spikes that occured in this range.

So how do we find these? Here's the step by step:
1. Make sure you are working with the proper extensions. I typically only use 3 extensions. They are 1.618, 2.0 and 2.618. On rare occasion I'll look to others. The reason I use these are based as much on a global standard as they are a logical one. The golden ratio is the mother of all Fibonacci. Every other number you have ever used in relation to Fibonacci is based on this number. There is a global deliberate purpose to use this as much as there is a coincidental one. And around here we love global standards. 2.0 is a natural point to take profits for many. We are mainly going to focus on 1.618 today for some obvious reasons – the primary being that it is simply hit much, much more on a regular basis. There is less room to consider.

2. Ideally within a price range, start with your most recent high or low. You are looking for the first meaningful pullback. This is best explained visually so just take a look at the chart below:
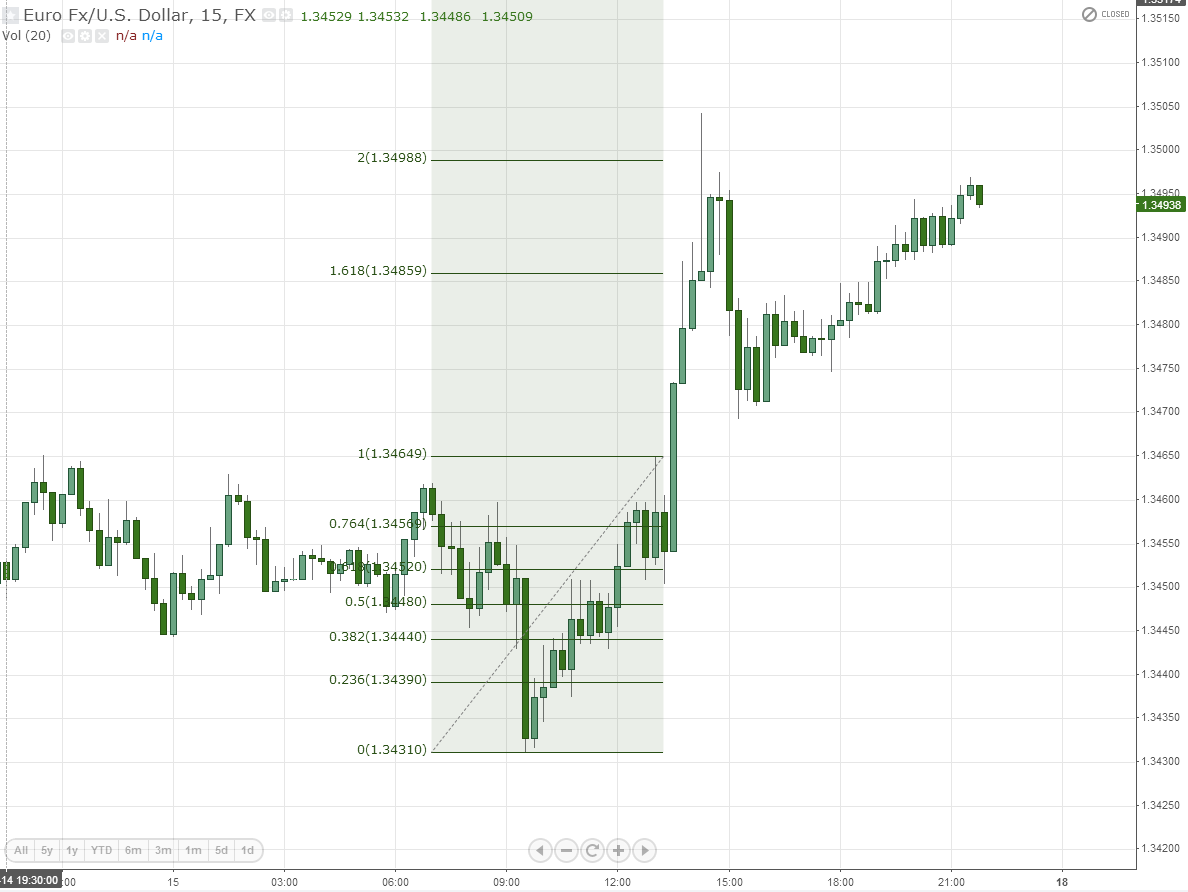
To explain further, our measurement starts at the base, and ends at the local resistance. Any extension beyond this point is expected to shoot, at minimum, 161.8% of that range. Let's keep going:
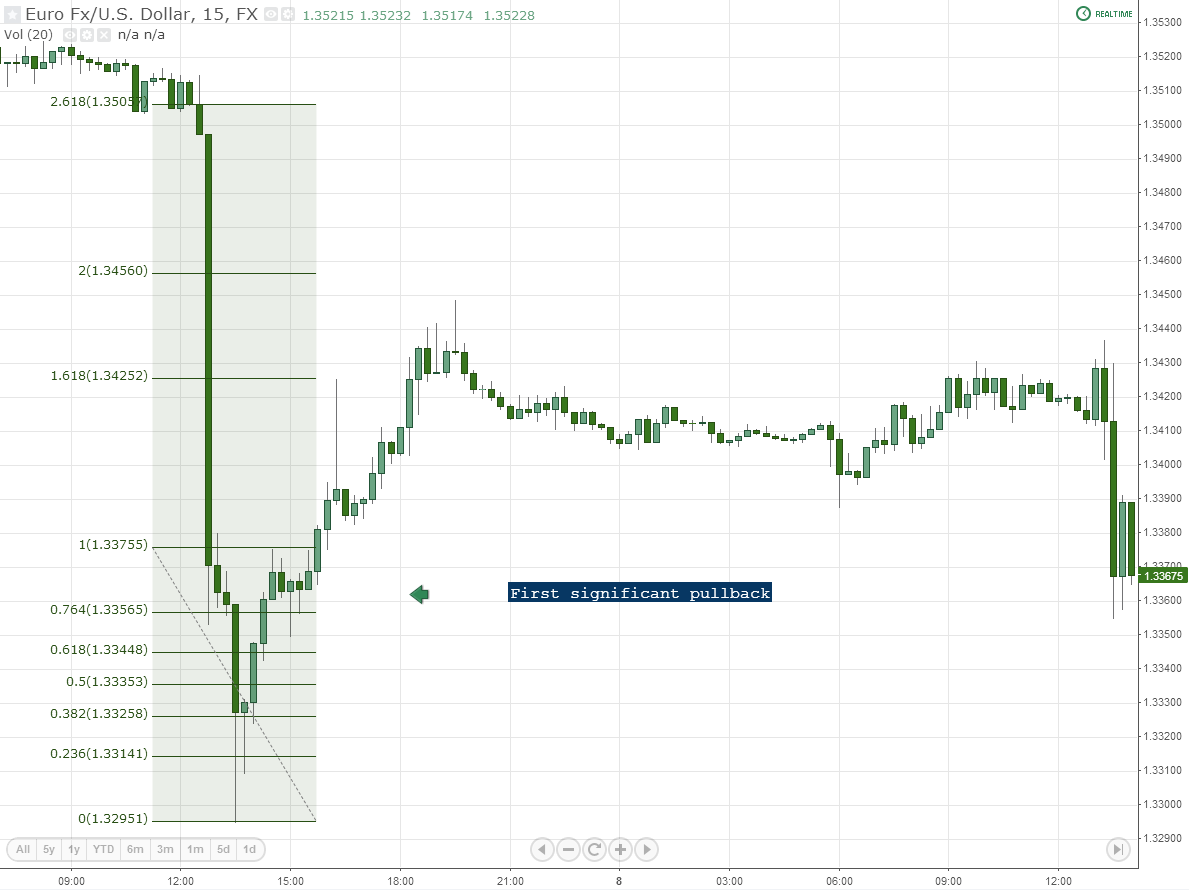
Here we have our ECB rate announcement in which price violently shot lower, followed by a series of harsh rhetoric, driving the retracement higher. Following our first significant pullback, we start measuring, and expect price to travel yet another 62% before relaxing. We subsequently shot higher, not fulfilling 2.0 (but this was seen as resistance a couple days later) before entering yet another range.
The next move:
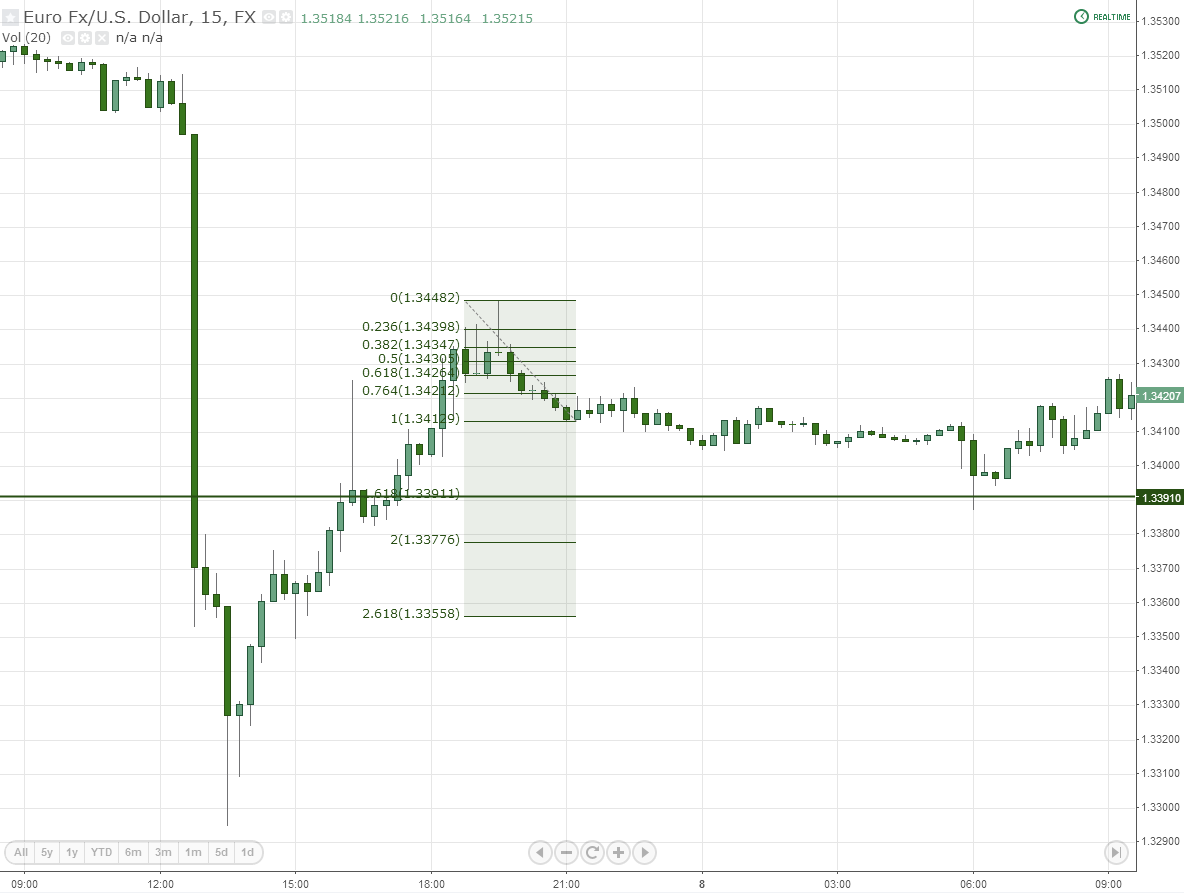
Following our peak (which was a golden ratio measured move on a diagonal trendline – hit it literally to the digit), we pull back. Our first pullback in the opposing direction coincides with a measured move from the first leg, yet again.
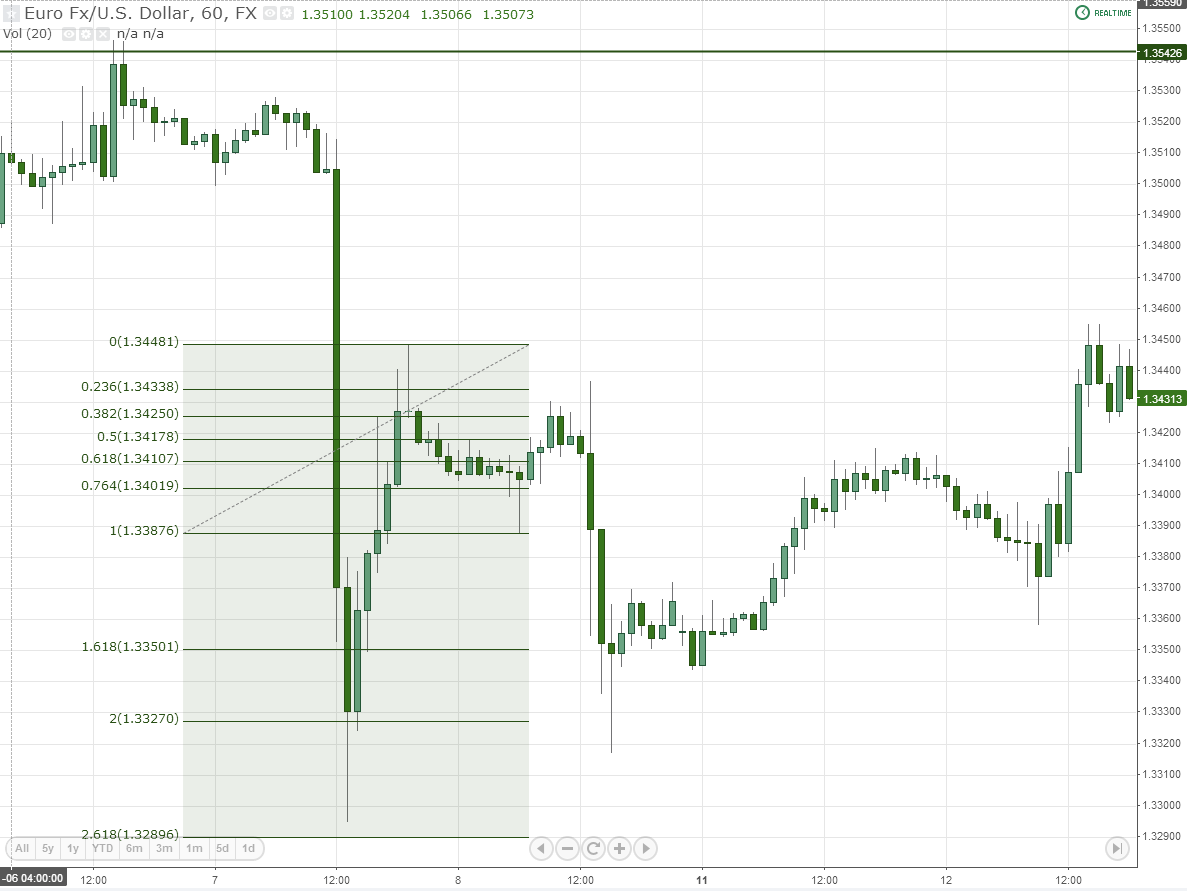
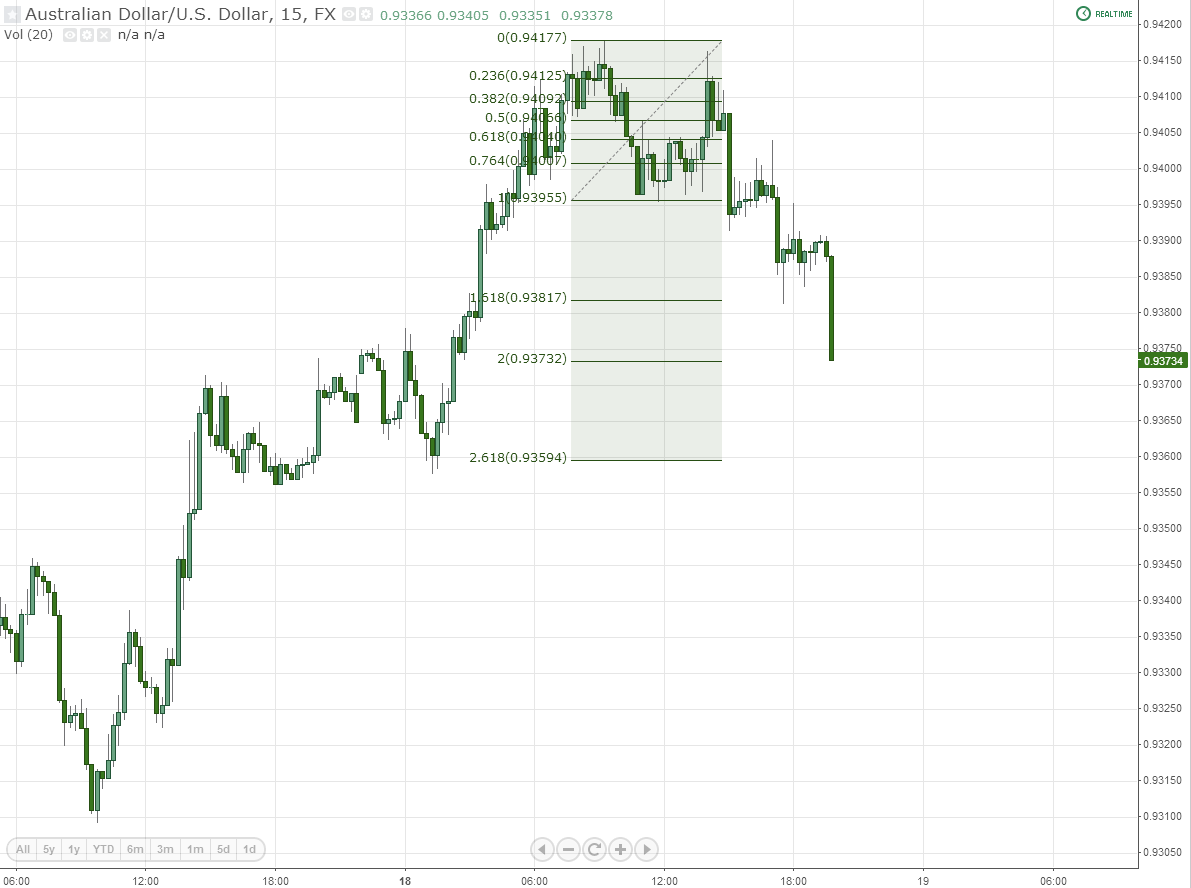
These can also be applied to higher timeframes:

Today's high coincided with a move off of that entire first range. Again, this is also lining up with former resistance in terms of another measured move so we've got some confluence here. The high (1) thus would represent .618 of the spike peak to base. It's a renewable cycle and again, there is a deliberate purpose involved here as much as there is a coincidental one. Keep that in mind. Coincidence is what follows most retracement methodology. We are seeing out deliberate reasoning, and it is why we rely so heavily on extensions as opposed to the former.
Next move, same chart, 1hr timeframe:
I was hesitant as to whether or not to include this chart because our drive lower occurred during a nonfarm payroll release, and so the market was still very much hot in terms of volume-based trading. But if you were to break this down you would see a reaction registering off of 1.618, with 2.0 catching fire as exhaustion came into play.
Fine Tuning Your Exits and Entries
Of course there are other methods you can use to fine tune your levels, high probability price patterns being one of them. Triple taps are a prime example. These are fantastic local structures that provide a deep level of support and resistance, and can even be further measured to arrive at other profit targets or support and resistance zones.
Confluence is of course #1 in terms of relevancy with any new position and it usually doesn't take much when a measured move is confirmed. Most inner trendlines or heavy historical horizontal confluence will suffice.
One Major Exception to This Measurement Process
I will keep this simple and as I stated above: don't use these on spikes. Spikes are unique and have their own set of rules by which we can measure them, and it is also why I omitted them from the first chart in this post. Oftentimes I will measure the “head” of a spike in order to determine failure as well, as demonstrated below, and this is not to say that the fundamental cause for the spike needs to be evaluated first. It most certainly always needs to be.
And a couple more examples before we go:

So it is fairly simple, and there are many, many ways these can be and have been interpreted. This post covers the major brushstroke, which is all I can do. I could sit here and turn into a skeleton showing you examples of these, but it would essentially all be for waste as you are not looking at them yourselves. So be curious and explore.
Why This Post Matters
I could come up with a slew of explanations as to why these occur. Simply stated: it doesn't matter. They occur. And that's all you should care about. I am not here to make myself sound any more intelligent than need be or what I actually am; most of all, you simply need to be conscious of the fact that this is happening and there is a logical and deliberate explanation for everything. We are all in the same boat – learning to trade is damn hard.
Order flow drives this market. Concepts like this drive order flow. You have to think of what the most logical explanation for anything should be, and at all times. It's really not that difficult when you see the market for what it is: an elite playground where the weak get obliterated without any mercy. Figure out where the orders are, and you solve a huge chunk of your problems.
In case you are wondering where you can learn more about these, again, you won't find much as it's original to my work. The only other guy I know that discusses measured moves outside of the traditional AB=CD sense is Al Brooks, and a variation of, but not this exact concept is tucked away in a small chapter of one of his books. I discovered this concept roughly 1 1/2 years ago while I was fooling around with a pattern recognition software and it is one that I have found to hold the the highest integrity. Al lists other means of discovering measured moves, although I have not been able to find a consistent means of discovering these. I found them to be very vague and again, based more on coincidence as opposed to deliberate means, much like the traditional way of drawing Fibonacci retracements. But that could be attributed only to my interpretation of the writing.
So I repeat in terms of effectiveness, stick with diagonal break measured moves and these as your primaries. Since I published the first article, I have been hit with a lot of great feedback and questions, as well. The most common question involves the target, to which I have a short answer: stick with 1.618 in the beginning. Consider it your training wheels. Your hit rate is higher because the objective is closer and it will allow you to get a good feel for them in terms of success. And any more questions, please let me know.
As usual, fire away, be creative and see for yourself how you can incorporate this into your own trading. Please leave any questions or findings below so everyone can benefit. I am always curious to hear about observations and respond to all comments.
Thanks,
Steve
PS: Please help us out by sharing this post/spreading the word. Every one is a major help and helps me keep this site moving along. Thanks again.


