A few weeks back we covered measured moves on trend line breaks using a 2.0 (100% extension). Regular visitors to this site have seen it used in other contexts as well, namely the Golden Ratio (1.618), cited quite a few times in our Quick Charts section, as well as our social media channels. I have also received more than a mentions via readers on these channels, emails etc., that tells me that the the crowd is listening and we're starting to get closer to seeing the light behind these exhaustion points. Today we're getting back to measured moves, but in the context of volatility.
This topic is one which happens on rare occasions, though certainly during times where uniformed traders tend to get hit the hardest. Because of its rarity, I was going to hold off on this post, until I realized #2 in the previous sentence.
First, let's bring everyone down to ground level. What many traders classify as spikes simply are not, and therefore we need to tiptoe through this, at least in the beginning. I want to explain how this market normally reacts to events, what a true spike is, how they can be identified, measured and traded.
True spikes are event-driven. On any normal day without surprises, this a forward-looking and oftentimes slow-to-learn market. Steady trends or more likely, trading ranges are the norm. Humans and their algos are trained to trade “into” events that have yet to occur. In other words, the market expects something to happen, and in expectation of that event, price trades higher or lower before the “deadline”.
A while back on this site I posted several examples of this. You can find one here. In this particular case, Moody's threatened to downgrade several European nations. On the back of no change in status or other strong influence, the Euro traded lower in the month that ensued. When the downgrade finally happened, EUR/USD had the opposite “intuitive” effect, and actually traded higher.
But what's intuitive? A new trader would think that an event like that would sink the Euro, not cause it to move higher, but well, it already did. A month ago. You missed the boat, buddy. The market already knew about this possibility when Moody's placed these countries on outlook negative, and so the event, which didn't even happen yet, was already “priced in”. When Moody's pulled the trigger and downgraded these countries, informed participants viewed the Euro as oversold, and traded it slightly higher.
Intuition, when you look at it this way, is really just common sense, but indeed you really have to think of the pattern of events before you start to do what long-term traders do naturally.
Quantitative Event Trading Versus Over-Simplistic Assumptions
Spikes don't differ much in this regard, they just happen over a smaller window of time. A spike occurs in the first place because the market has just learned new information, information which is not yet “priced in”. Depending on the severity of the information, the spike will be large or small, and continue or fail. To explain this concept a little better, I'm going to cite what several event-driven quantitative strategies do on a regular basis:
Developers of these event-based (spike) trading strategies are able to quantify data retrieved from economic data releases rather easily. They just take the deviation from the actual and expected number, couple it with other economic data releases that happen at that point in time (if necessary), take the average change in price before and after certain deviations occur, the timeframe in which these changes happen, and are able to optimize a strategy based on this and any other technical factors they wish. They have a history of data (numbers) with which to work.
In all of the factors listed above, numbers are available, and machines need numbers. But what happens when a spike is caused by a comment from a high ranking government official? No numbers there, just words. Yes, words.
What about words? Words, when it comes to programming, can be numbers. Let me explain:
Words are weights, when measured against each other in relation to price movements. “downgrade” carries a different weight than “stimulus” or “defend” or “protect the currency”, etc., depending on who it is coming from and the context of other other words used at the time.
High and low ranking government officials can be weights. The high ranking government official weighs more than a low ranking government official, etc. A ratings agency, and the words used in their press releases, can be weight. Etc. etc.
So when you take an industry standard news feed, assign weights (numbers) to everything mentioned above against average price movements, time, other technical factors, etc., you end up with a sample of data that can be optimized into a potentially profitable trading strategy.
And while I know it all might sound ridiculous at first, if you think I'm just pulling your leg on all of this, think again. While I'm giving a very simplified explanation of the concept, it is indeed used in mostly all markets by various participants, and definitely in this one.
Ignorance is Not Bliss
The reason I'm spending any time explaining what I did above was just to hopefully open your eyes as to just how complex deciding whether or not a spike will continue, can be. It is not for the beginner, yet most beginners drool over the potential fast money that can be made trading these things. And most get killed in the process, because they're basically showing up at the O.K. Corral with a BB gun. They have few, if any statistics, with which to work, or optimized strategy, etc. Not to mention latency in execution issues, etc.
As rare as spikes can be, absolute conviction in terms of their continuation is even more rare. As an example, for myself, with everything I know at this point, it might happen 2 – 5 times per month depending on the context, and 5 is pushing it. I'm just human. Any other human with a normal capacity to learn is probably going to fall in similar territory.
I'm talking about seeing an initial first reaction to the data or event, and within seconds of digesting the headlines saying to myself “yes, so long as nothing else interferes, this is going to continue, no question about it.” But after the spike occurs, what then? What other means of assessment do we have?
Defining a Spike
Just because price is accelerated compared to recent previous history does not mean that you have yourself a true spike. As we discussed in last week's article, price commonly accelerates right ahead of trendlines, only to hit, and reverse. These aren't spikes, but rather just normal market behavior. Newer traders are likely to confuse this with spikes. So before you even THINK of entering a long or short trade attempting to “follow the flows” make damn sure you don't have a trendline dead ahead. That's called chasing price, not thinking like a trader.
A true spike consists of at least one single bar with very large range at the beginning of the movement. I generally refer to 5 minute bars when I say this. Smaller bars stacked on top of one another in a parabolic movement aren't spikes. They are just aggressive trends. Please make sure you are covering this idea first an foremost before reading onward.
If you learned anything from the information that we just discussed above, spikes need some form of information surprise in order to act as a catalyst for the movement. Only then, based on that catalyst, can we then start to assess the longevity of the movement.
But to sit here and list my own manifesto of reasoning behind spike continuation versus failure is basically futile. I would probably be here for weeks. And “summing it up” does little, as well. The description above should get you moving in the right direction in that regard. But from a technical perspective, that's another story, one which we explain through a few concepts now:
The Breaks
Most people would define a spike as price swiftly breaking out of a range. To some extent, I agree with this, but when you describe “the range” as a strictly horizontal block in price, I disagree. Here are a couple of very recent examples to show you what I'm talking about here:

Shocker I was going to use diagonal trendlines to do this, right? But why would I use trend lines as opposed to horizontal “blocks”? Well, one of the earliest books I read on trading in my early days told me to buy such a breakout on a horizontal block in price. Long story short, I got slaughtered. “False breakouts” (another term I loathe, but for the sake of simplicity I'll use here) are very common. These “false breakouts” poke below or above a range, and reverse. There is nothing “false” about these breakouts, by the way – maybe “false” to the person that doesn't quite understand them – they are just another part of price, but that's another blog post.
This concept is actually much more easily done manually than it is structurally. First of all, trading any true spike in price, the likelihood of you entering within the first 5 minutes should be rare, unless you're doing this mechanically (with a program) and direct access to a massive pooled ECN or other direct access network. Many people reading this might be wondering about the tons of spike trading software out there. Hmmm, yeah, well good luck with that. Here at NBT we tend to favor reality and can't say we are fans of the people telling others that this kind of trading is in any way acceptable on a sub-par platform with low access to liquidity. Please read on.
You want the initial whipsaws to subside and a true direction to be declared. Sometimes, it will happen after the first 5 minutes. Others, it will take as much as 20-60 minutes before an optimal or confirmed entry is found, depending on the conditions and catalyst.
Measuring Spikes with the Golden Ratio
One of the primary goals of this article is to help train you NOT to fade sharp drives in price. When there is uncertainty in the air, most traders no darn well they shouldn't be doing anything, yet they do it anyway. If you suffer from continuously “picking” at countertrend trades, please pay special attention:
There are two primary reasons we would want to measure a spike in the first place:
1. To find a potential exhaustion point at which to take profits if we are trading in the direction of a spike, or
2. To fade the movement
This is the second writing I have here now about measured moves. In the last article about this topic, we only discussed using 2.0 (100%) on a trendline break.
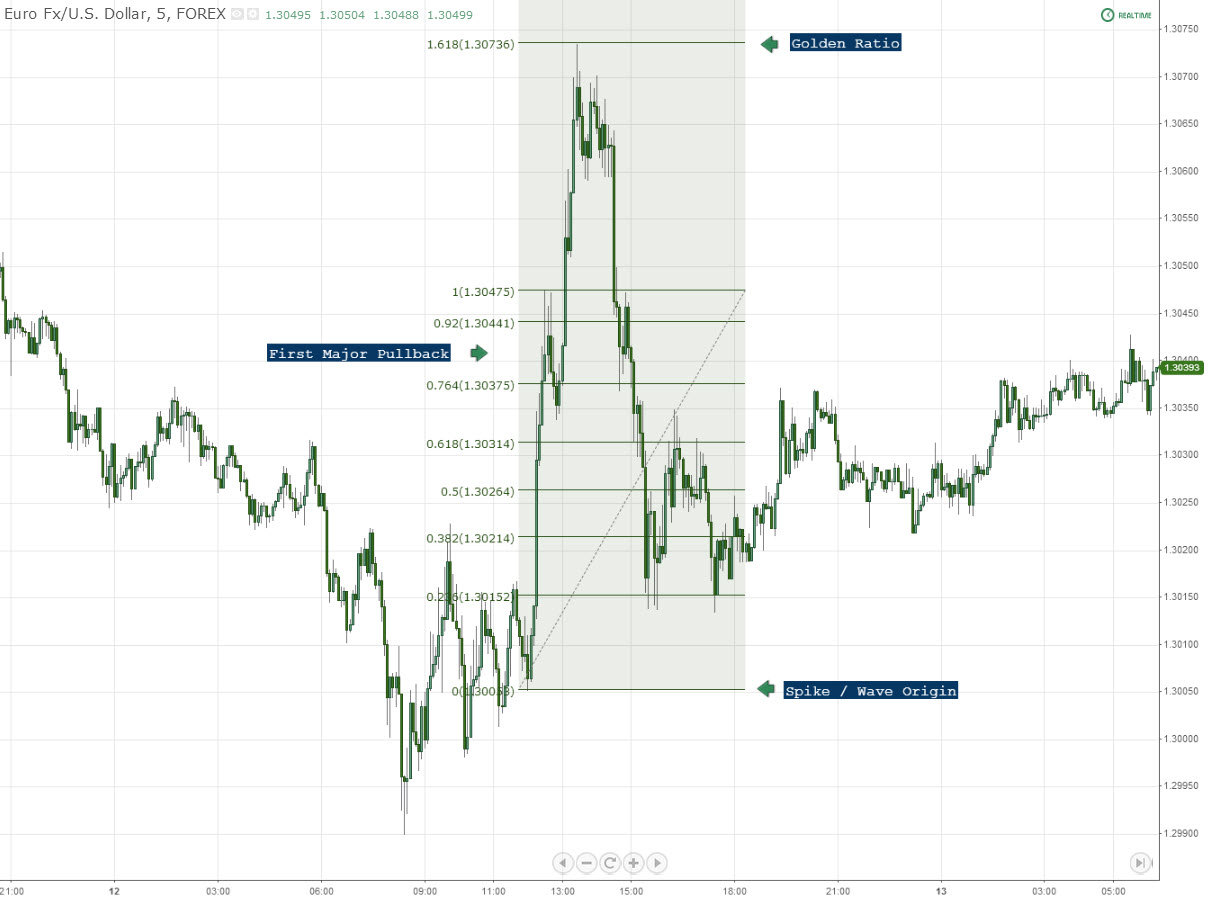
Spikes can be measured in several ways, and fair warning: what you see below might be a little controversial to long-time strategists, but like everything else on this website, I write about what works for me, not what I read in books. So without further adieu, let's take a look at some examples:
All charts below are 5-min timeframes.
Spike moving high:
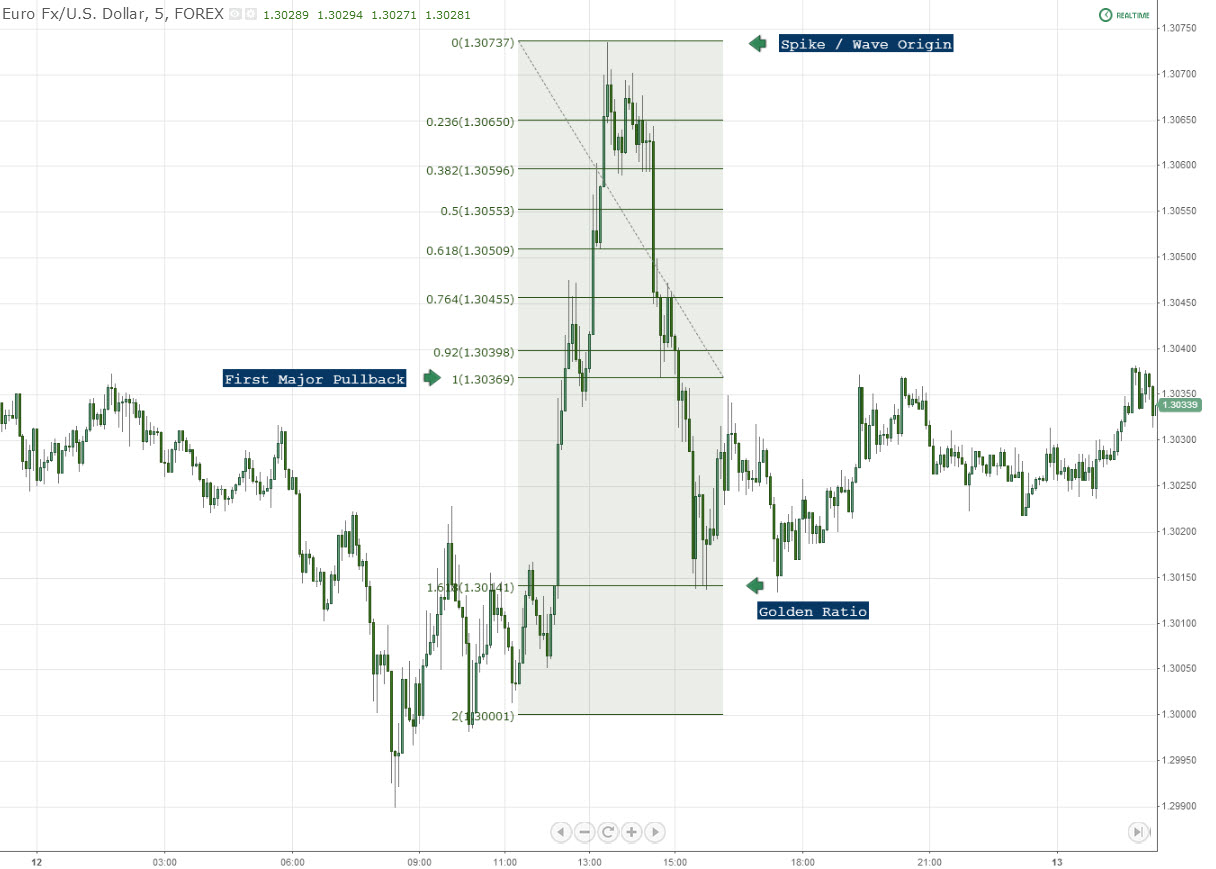
And again on the way back down:
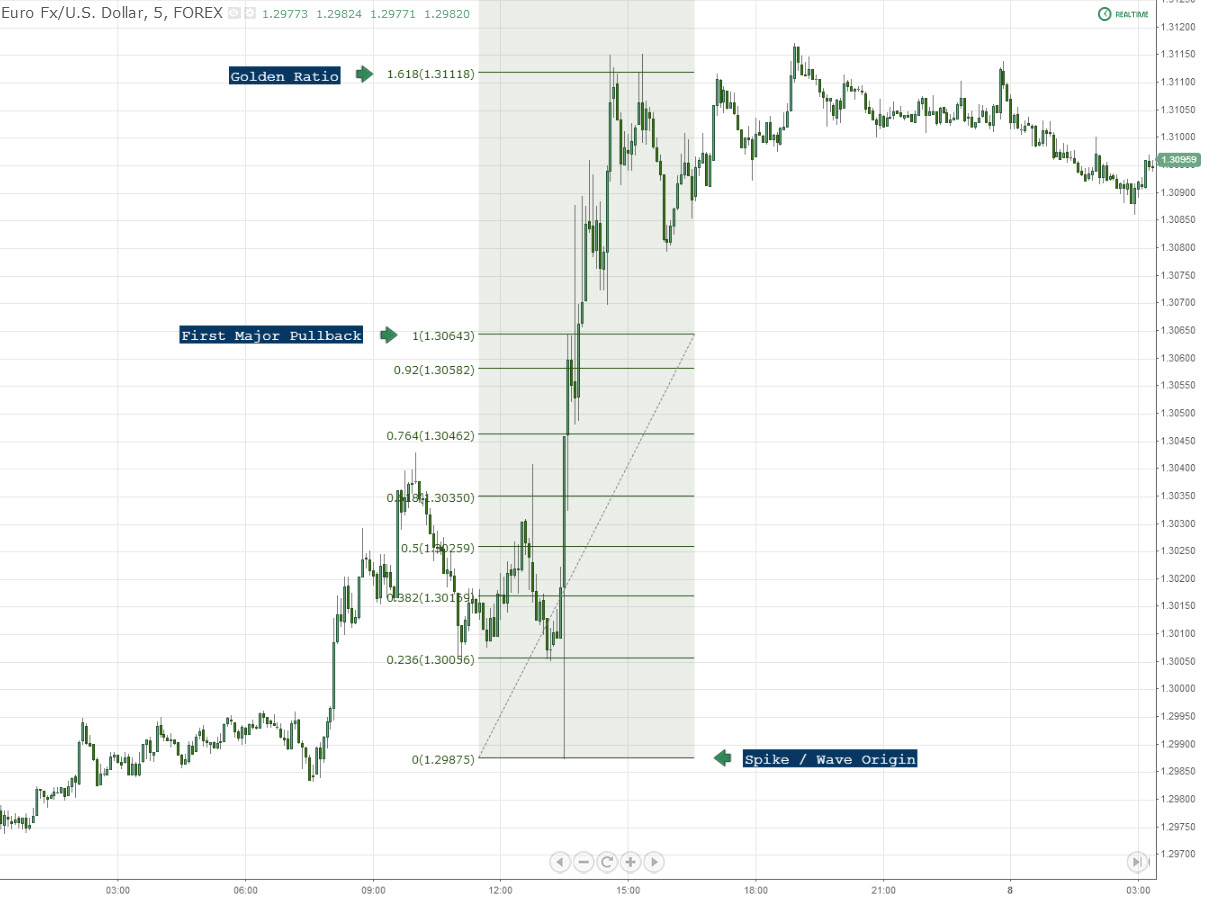
Nonfarm Payroll Announcement:

Slow but steady following this move:
British Pound:

Another alternative to measuring moves on spikes is to simply use the same concept we discussed several weeks ago: trend line breaks and 100% extensions. One of our readers was quick to find the bottom using this same concept following Nonfarm Payrolls (confluence with the same chart above). Click here to see his chart. Confluence…..rules…….always.
Spike Failures
Spike “failures” are just as common, if not more, than spikes that continue themselves. The reasoning behind is pretty simple: high frequency algorithms are trading right off the initial data release. As the data gets digested, reversal or continuation is determined as traders commit.
There's not too much to speak of here from a technical perspective other than the fact of watching what happens circa the initial pullback in price. Here is a perfect example of what I'm talking about:
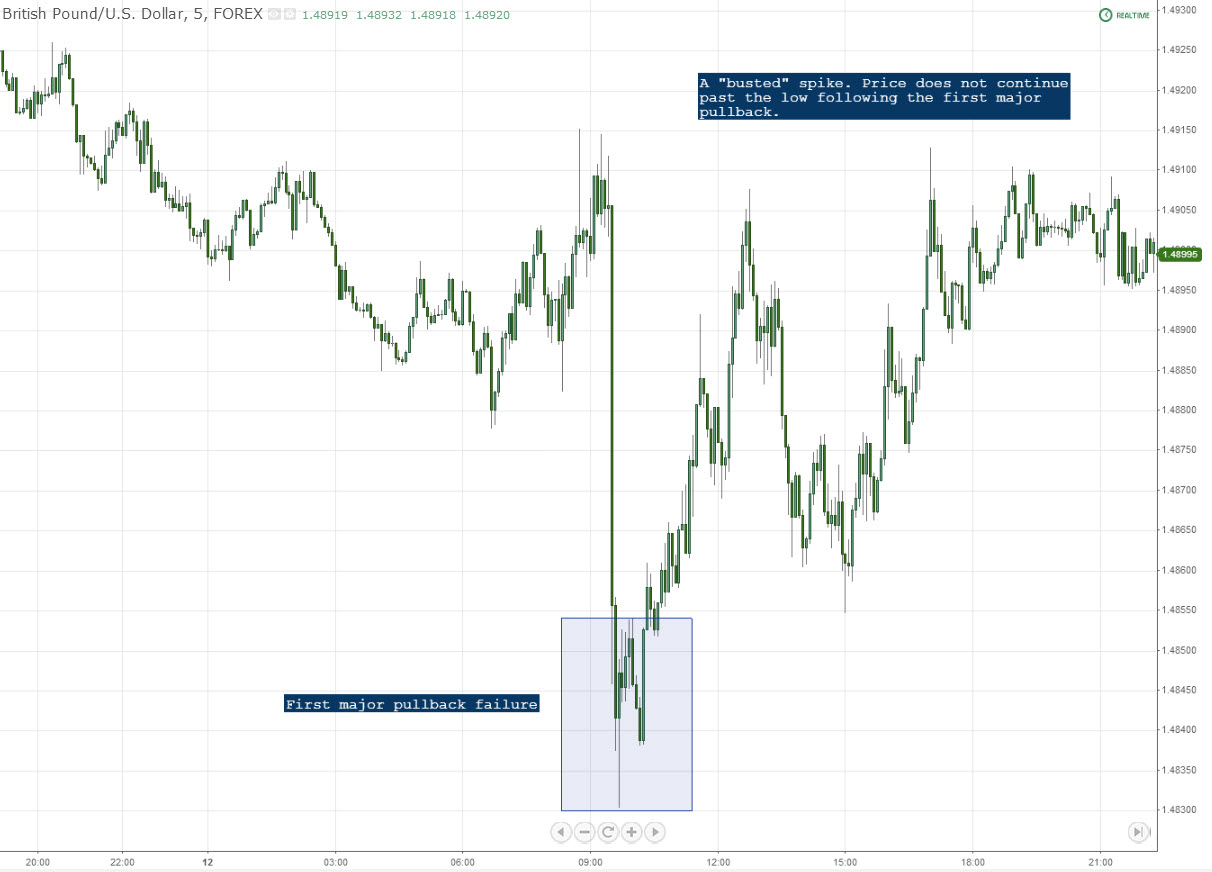
So bottom line: heed extreme caution around that initial pullback point. Chasing the movement without any form of confirmation in terms of continuation is going to be your killer. Quick stop losses in quick markets.
Volatility Is Not a Toy
Before we get too far, I'm actually going to stop. Why? Because I know this concept can be taken out of context. I want to make sure I reiterate the key points here:
1. True spikes that continue are rare. If you're attempting to trade in the direction of a spike, please refer to this article in terms of catching major pullback retracement points, but use extreme caution and be sure to carefully asses the situation well in advance of trading time. Just be prepared and use common sense.
2. Spike reversals are just as common, if not more, than spike continuations.
3. When in doubt, stay out. Measuring a sharp move in price is one thing, but it is only one part of the equation.
Indeed, one of my subconscious goals for today was to just raise awareness as to how ill-conceived commonplace strategies surrounding spike trading can be. Spike trading is perhaps the riskiest and toughest of all forms of trading, yet for some reason a idea exists that makes it seems like an easy process.
More to come on this topic…..still getting started around these parts. Thanks for stopping by and see you soon.
Steve
Chart Sources: http://www.tradingview.com
———————————
Please help support for our free site by sharing our articles with friends and colleagues. Every visit helps us out tremendously and we strongly appreciate your efforts.


