Well, the worst of my tendon injury woes are over and so I'm back to drawing charts……and I can't help but feel like an addict about to overdose. Finger still limp but enough of the gross stories for today….let's talk charts:
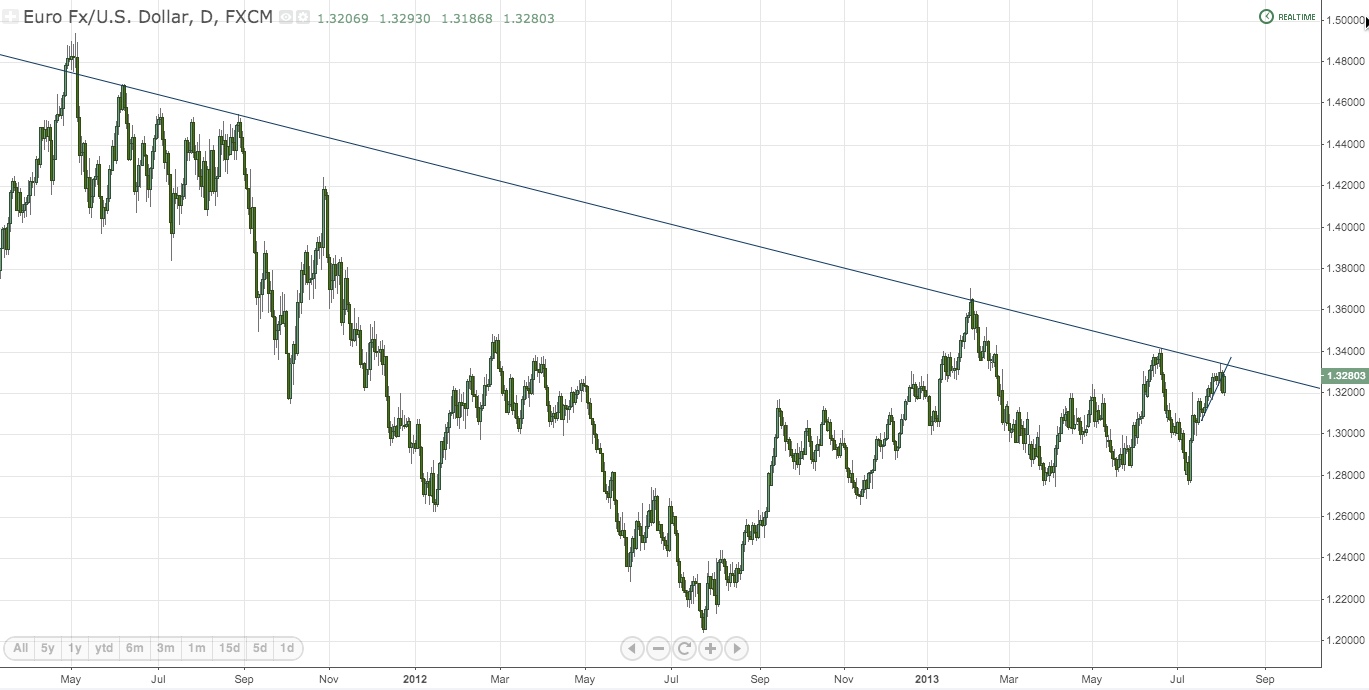
Just one of my notes in expectation of next week's activity….EUR/USD faded off of a very prominent inner trendline this week. Choppiness is back into play after the ECB essentially mimicked the Fed in terms of their failure to budge on interest rates this week. Daily chart shows the fade as well as a high today made on a line in the opposing direction (this is also a confluence point with horizontal inner resistance). Certainly not rocket science but these are the majors to watch for the time being. Short term chart shows the 2.0 extension being used as support after the NFP spike. Heads up on the upper trendline. Likely to have buyers looking to use that line as support for any continued moves higher in the interim, with fades just below it.
Chart Source: https://www.tradingview.com/u/nobrainertrades/


