Just catching up from last week in terms of quick charts as we had some critical issues with the back end of this website. These charts were posted to Twitter, my normal go-to feed for any intraday analysis. Three of them here, I'll be brief:
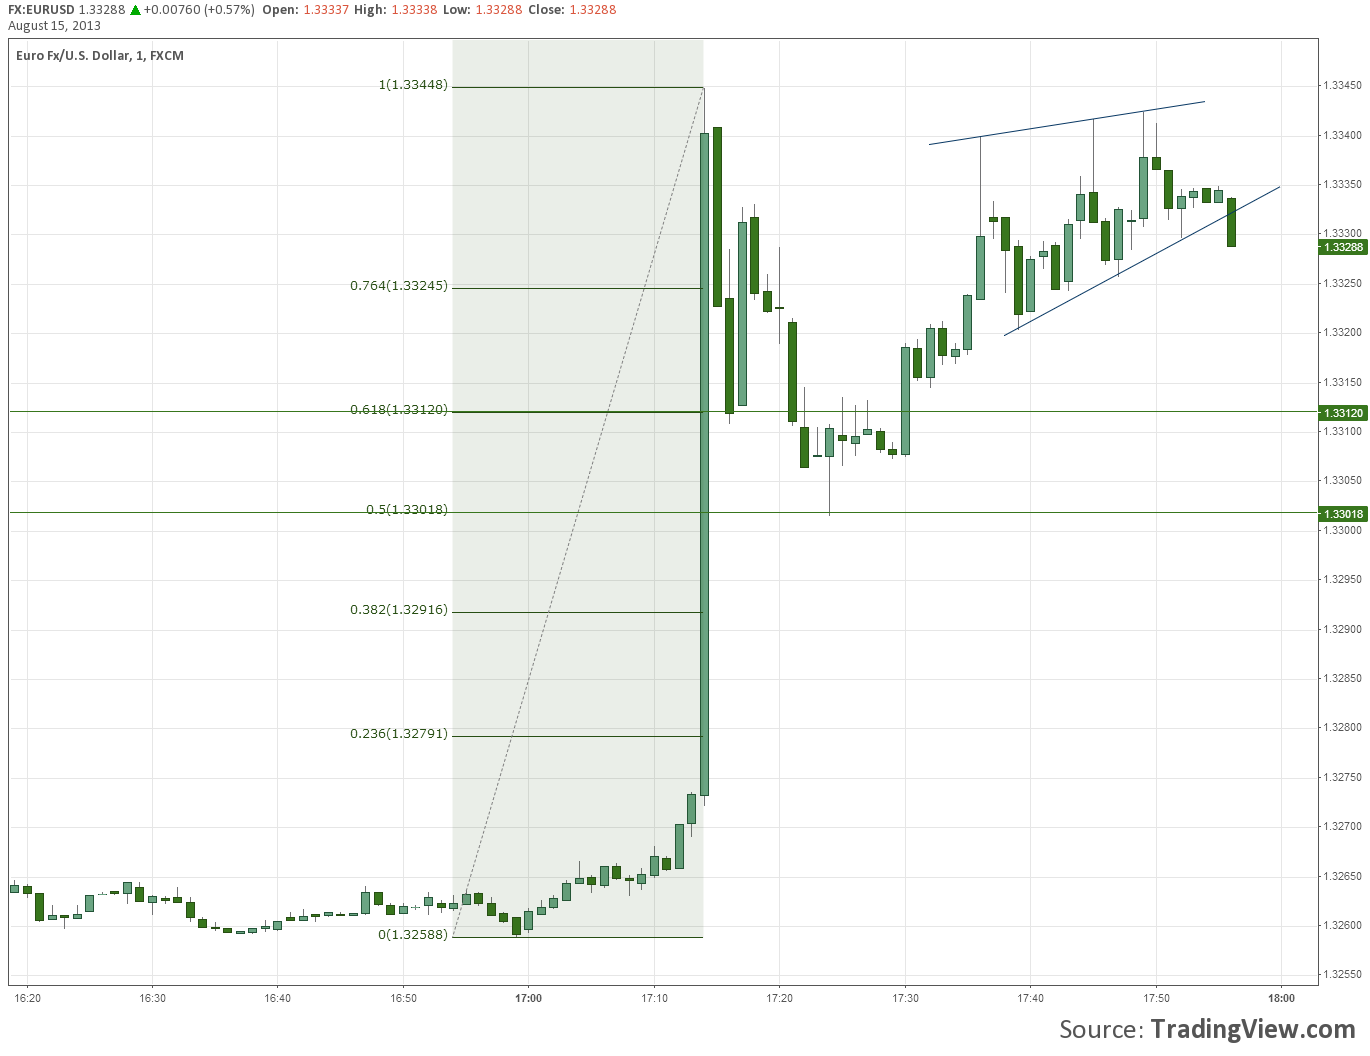
1. Measuring the Spike
This was a rare spike which released a string of flows, or just cascading stops across a basket of pairs. Naturally, this effect spread across a number of pairs tied to USD and shook other crosses as a result. It originally peaked out at major resistance (not shown) visible on an hourly as well a measured move of a trendline break confluence. We measure these spikes themselves to gauge any form of continuation. 50% of the last leg typically holds up in trending environments, but caution was admittedly used on this one as the source of the spike wasn't clear.
2. Triple Tap Atop the Spike
This was low yield yet very predictable triple tap that resulted after the spike. It occurred during lower liquidy but still provided us with a good RR intraday with a max appx 35 pips profit before entry was enveloped.
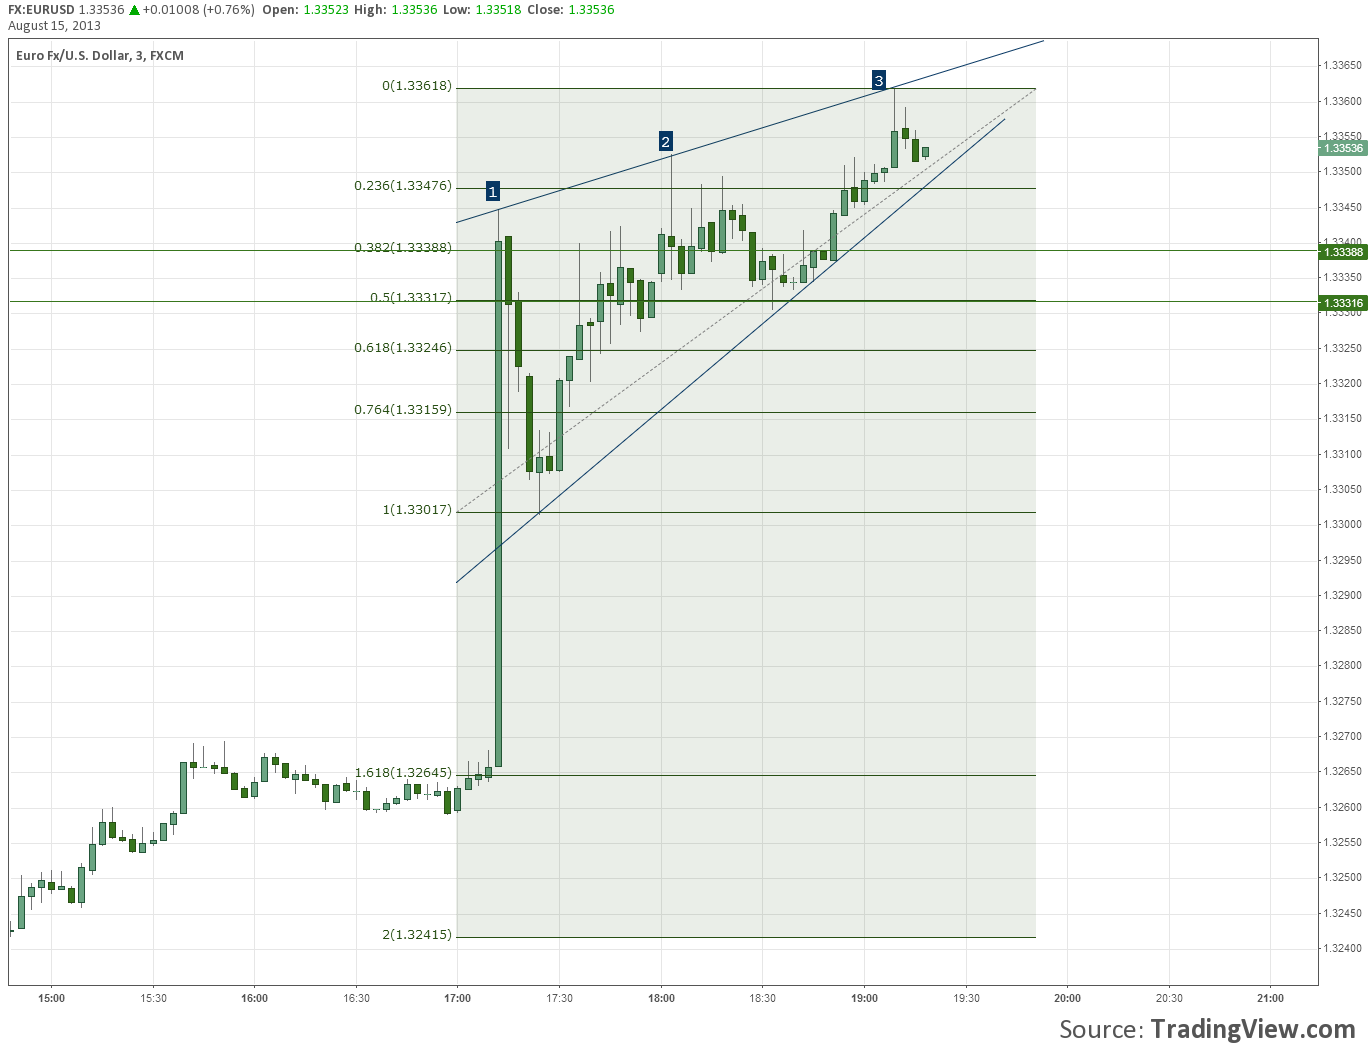
3. Measured Move to Fail Continuation
This will be discussed in further detail in future posts (specifically when we talk about measured moves on price ranges), but we prefer to use 2.0 as a rule of thumb on measured moves in aggressive trends. Why we do this should be rather obvious. Remember to always look for that retest. A 5 down to 1 min was needed for this one.

For more on measured moves see here: http://nobrainertrades.com/2013/02/measured-movements-trendline-breaks-taking-profits-redesigned.html
For more on Triple Taps see here: http://nobrainertrades.com/2011/12/triple-taps.html and here: http://nobrainertrades.com/2013/06/momentum-based-triple-taps.html
Chart Sources: https://www.tradingview.com/u/nobrainertrades/


