I haven't been nearly as active on this blog as I would like to be in the past few years, and so please consider this post more a framework so some of you can better understand my own interpretations of volume profile, as I receive a decent number of questions about it.
This is less of a “how to” post and more of an interpretive one. I would expect anyone looking for details to come back to this as a reference as opposed to reading it once as a 1-2-3 and done, type of thing. It's not expected that everyone would understand it in one shot, particularly those who know very little on the subject. Overall, I tend not to write articles geared towards beginners because so many others have already. None of them will turn you into a star trader, but rather push you down a path. So if you're looking for more, the original texts on which much of this work is based are discussed below. They are worth your time and I encourage you to read them.
I don't think there's any form of analysis that doesn't initially present a boatload of challenges. It is one of the many reasons so many people struggle in this business and why 10X as many more misconceptions (around it) arise on a regular basis. Volume profile is no different, and the difference between a beginner and an expert on this subject is like night and day.
In my own view, volume profile is the type of thing where you either understand it fully, or not at all. Rapid fire plotting of levels derived from distributions don't lend themselves to the full picture, which can hinder your work in many different ways.
Before we get too far, some (very) abbreviated history: Before there was volume profile, there was market profile, which uses time as a constant. Market profile was created by J. Peter Steidlmeyer, a CBOT trader, and became very popular with pit traders and the like back in the mid to late 80's. It uses standard deviation of normal distribution to identify value on the daily (aka intraday) timeframe.
There are only so many things you can use when it comes to short term, intraday trading. Medium-term, swing trading is certainly different, but methodologies for identifying ideal points of entry, exit, etc., are not. And many of these levels, as derived from standard, classic, technical chart analysis, originate in the distributions known as volume profile.
Short term trading is unique in the sense that only so many methods may be used to trade it, and this is all the more true from a discretionary sense. Based on fundamentals and cross and primary market internals, one could create an intermediate bias, but then you're on your own. What you are left with essentially boils down to volume, intraday internals, cross market rates and many forms of technical analysis…..price action or otherwise. This is also why it is one of the most difficult forms of trading you can do.
With electronic trading (I know, I'm sounding like a dinosaur here) came the ease of plotting volume data with it, the slew of indicators we know and love (or loathe) today. Enter volume profile. In several of the books mentioned above, volumes are used as a reference in conjunction with market profile itself as an additional resource to understanding the data. When it was introduced, the CBOT market profile contained the then new “Liquidity Data Bank” data, which categorized the volumes based on the type of trader (think intraday COT data).
So finding references for (the concept of) volume/market profile it is not all that difficult. What is difficult is finding references that actually made sense to me. It is the tall tale that keeps getting taller, especially these days. The further you get away from the source, the more convoluted things become. So like anything else, if you want to learn it, go to the source or a third party that has interpreted the methodology in a manner which makes sense to you. Books are cheap.
As with other things trading, so much can be subjective, and I found this recurring pattern showing up in volume profile as well as I originally scoured sources left and right. But its validity was being proven to me every single day I used it, so I stuck with it, and attempted to mechanize it as much as possible.
Nothing has been more flexible and accurate when it comes to finding prices on which to execute. Much of the same can be said about many techniques using standard price action, but again…..interpretation. Yes, trendlines, as an example, are used and do indeed hold. But they also oftentimes get cycled around / turn into a mess, something which can be easily seen by plotting a simple distribution of volumes. Over the years, I have found that being succinct has its benefits. But there are many, many items that arise (no matter how you're trading) where experience pays off.
If you're new to profile, some quick terminology, so you know what we're talking about here:
Distribution: the total volume curve for the session. When we talk about the distribution “type” we're referring to its overall shape.
Value area: 1 standard deviation of the accumulated volume for the day. 68.2%, to be exact. Traditional market profile dictates 70%.
TPO: Time Price Opportunity. The building blocks of market profile, where letters indicate 1/2 hour sessions of the day.
ETH (extended trading hours) and RTH (regular trading hours) . These hours are set by exchanges and vary based on the instruments you're trading. For FX, I know several guys finding success using the Asian trading session as their ETH, segregating the remainder.
VAH – value area high. Upper end of the value area.
VAL – value area low. Lower end of the value area.
HVN – high volume node. An area consisting of y axis high volumes, aka consolidation per prices. These areas tend to attract liquidity (resting orders)
LVN – low volume node. A void in executed volumes / inverse of a high volume node.
…any others I might have missed I just recommend Googling. These are standard terms, for the most part.
And cutting to the chase…my own interpretations/usage based on the original texts:
To reiterate, this is not intended to be a 1-2-3 type of learning module here. Please just use these as a reference, if you choose.
- When it comes to high volume nodes and low volume nodes: the general rule of thumb is that high volumes accept, low volumes reject. This is generally true, but my own work and that of others out there led to some observations not explicitly stated in the books, specifically:
- The edges (where volumes drop off to a high degree) of high volumes nodes reject. I refer to these for entries and targets
- The highest points of volume for high volume nodes can reject. This is why I will commonly took to them as targets. This is particularly true in trending environments and on pullbacks.
- Material high volume nodes accept prices, but I don't recommend using this as a rule, verbatim. Prices can be attracted to liquidity, and liquidity likes to hang out at areas of previously executed high volume. This is a main argument for many mean reverting strategies. Prices get cyclical around these nodes….that's the bottom line.

- I don't mean revert often. I used to do it more often, but not anymore. Direction is the meat on the bone. Prices trading out of the value area present some of the better outcomes, and this is mainly due to risk.
- If mean reverting, trading to the mean / other side of the value area presents some of the better outcomes after prices have temporarily exited it.
- Traditional MP will teach to identify the type of distribution day early on and trade it accordingly. While I find it important to see how the distribution is unfolding, using the previous day's led to too much guesswork, and I still haven't found a way around it that makes me happy when it comes to a risk. When you're mean reverting on an intraday basis, you are largely going against the grain and relying on prices not breaking out. There's a lot of friction….I personally don't like friction and try to stay away from it. This means keeping away from aggressive fades. Obviously, this is not to say that mean reverting can't pay off. It does every day, all the time, for a range of strategies. This is just a preference I make based on my experience. Breakouts offer better risk reward on the whole.
- One of the first things you will come across when googling market/volume profile are day types. While I see them and can label them, I never adapted to these, personally. I'll give you a quick example: a “b” shaped distribution can be found anywhere on your chart. When you see it at a market low, the traditional interpretation is that new positions are accumulated and/or old ones closing out, and a retracement is on the cards. But you can also have a “p” at a base, or a “d”, etc. At the end of the day, I am still just reacting to longer term levels, in conjunction with intraday activity.
- Of day “types”, I pay the most attention to balanced days (where the distribution forms a capital D). The reason for this is that I'm expecting an impending breakout. It can happen the subsequent day, 2nd day, 3rd, and so forth, but its coming.
- Trends are relative. Most people new to trading are always looking for the exact, longer term price turning point. It usually doesn't take them too long to realize, however, that trends can of course just keep moving, in which case the value was to just go with it vs. fade it. Volume profile has been an invaluable tool for myself in terms of doing this.
- Large high volume nodes indicate firmness of an underlying movement. When the POC of that node, or its edge, is hit on a retest, expect a reaction. Likewise, breakouts from newly created, large nodes result in significant follow through (ie extended measure movements).
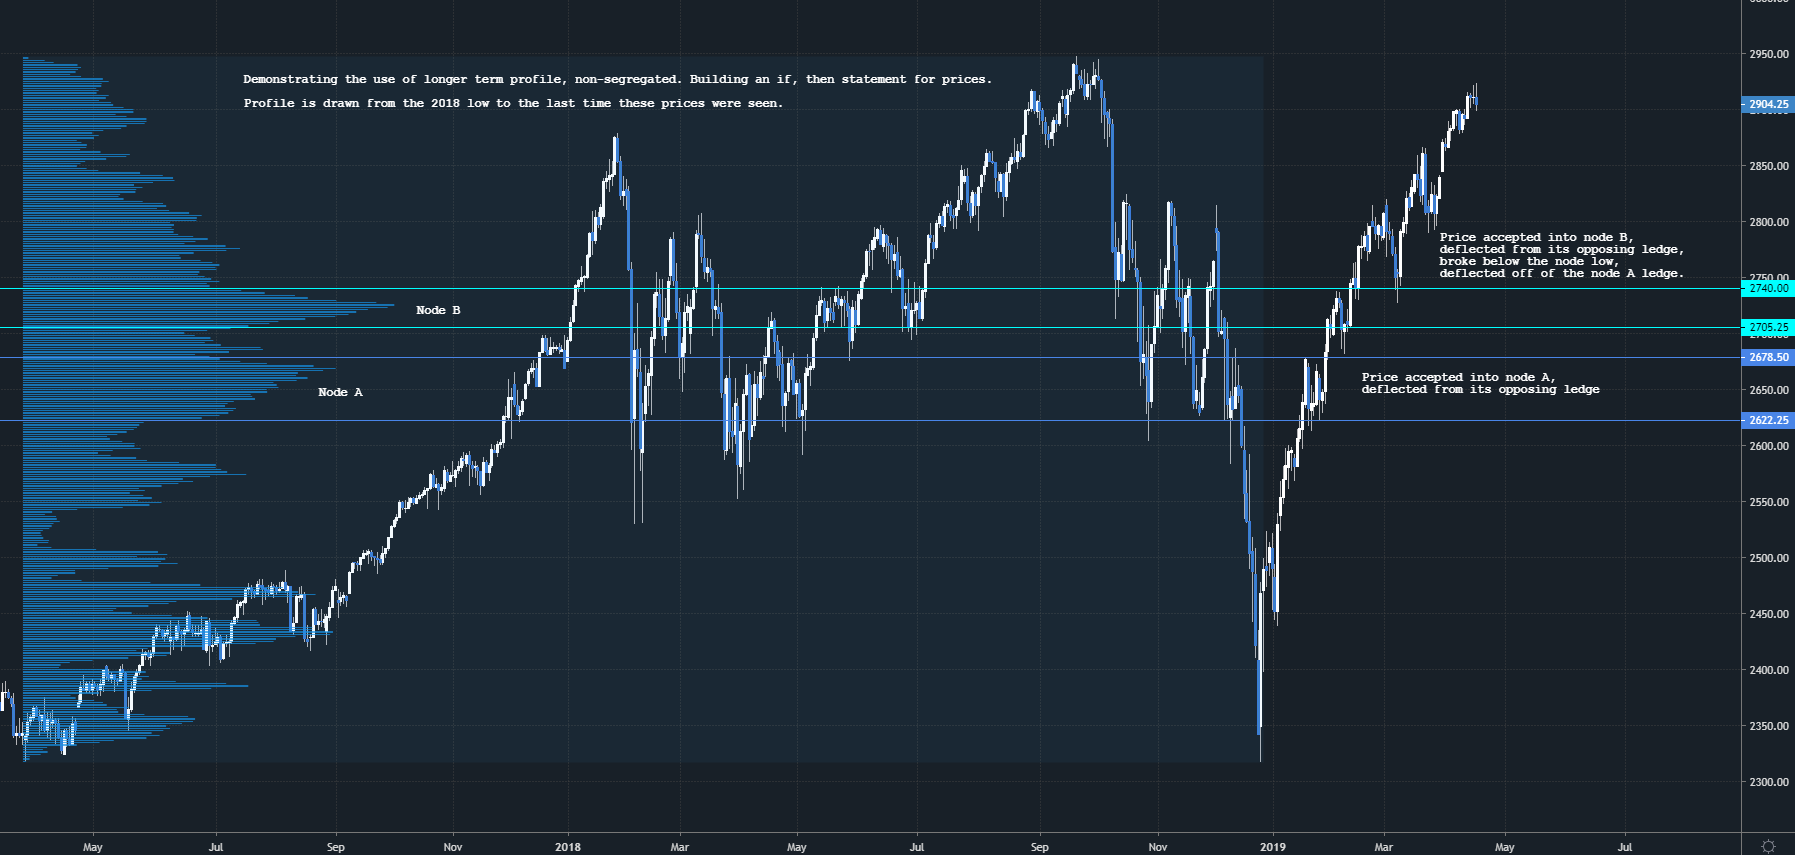
- Longer term levels (fixed range profiles over an extended period) can be used as a ladder or “if, then” statement for price. When price is accepted into a high volume node, we are now looking to the POC, then the other edge of it, and so on. Intraday, these longer term cuts in volume are responsive and need to be considered as much as your intraday levels.
- I do not use the profile to determine where price is heading unless price gets accepted into a material, longer term high volume node. In terms of timing, this is oftentimes ineffective on a day-to-day basis because it is unclear as to when the move will occur. Market internals, correlated instruments or derivatives, such as option data, can be used to better determine this.
- Strong breakouts occur through low volume areas, typically when price is moving from one high volume node to the next. Breakouts can be latched onto early by taking retests from the value area high and low.
- In my opinion, breakouts from the value area (1 standard deviation) present some of the best trading opportunities. To better confirm a movement (price taking off), you can use a few different things:
- Bid/ask pressure. Where is price moving, and how is that being reflected in market orders? For FX, plotting cumulative delta as ticks has a similar effect. You are looking for a happy medium between the two.
- Tape speed. People willing to take bad pricing (highlighted in on many panels) beyond x # of contracts.
- Various market internals, interpreted in much of the same manner as cumulative delta.
- Low relative volume on the pullback, with volumes increasing as the move goes forward
- I have not had success using longer term fixed intervals, such as weekly, monthly and so on. I prefer to use a fixed range profile on the last time prices traded through an area.
- POCs can deflect, but I would never recommend taking a trade off of them. It's a swimming pool of volumes, prime for misdirection.
- For chart setup: non-back adjusted intraday (not daily) data, volume-based rollovers for commodities, date-based can be used for index futures.
- I am not an “initial balance” guy, but I do look for open types, outlined by Steidlemeyer. The initial balance refers to the first hour of the day. Like distribution types, I find the work loosely wrapped. And while you can quantitatively determine what happens after this first hour, and how the first hour levels respond to this, I find the success rates underwhelming (for me personally), so I just prefer not to use it.
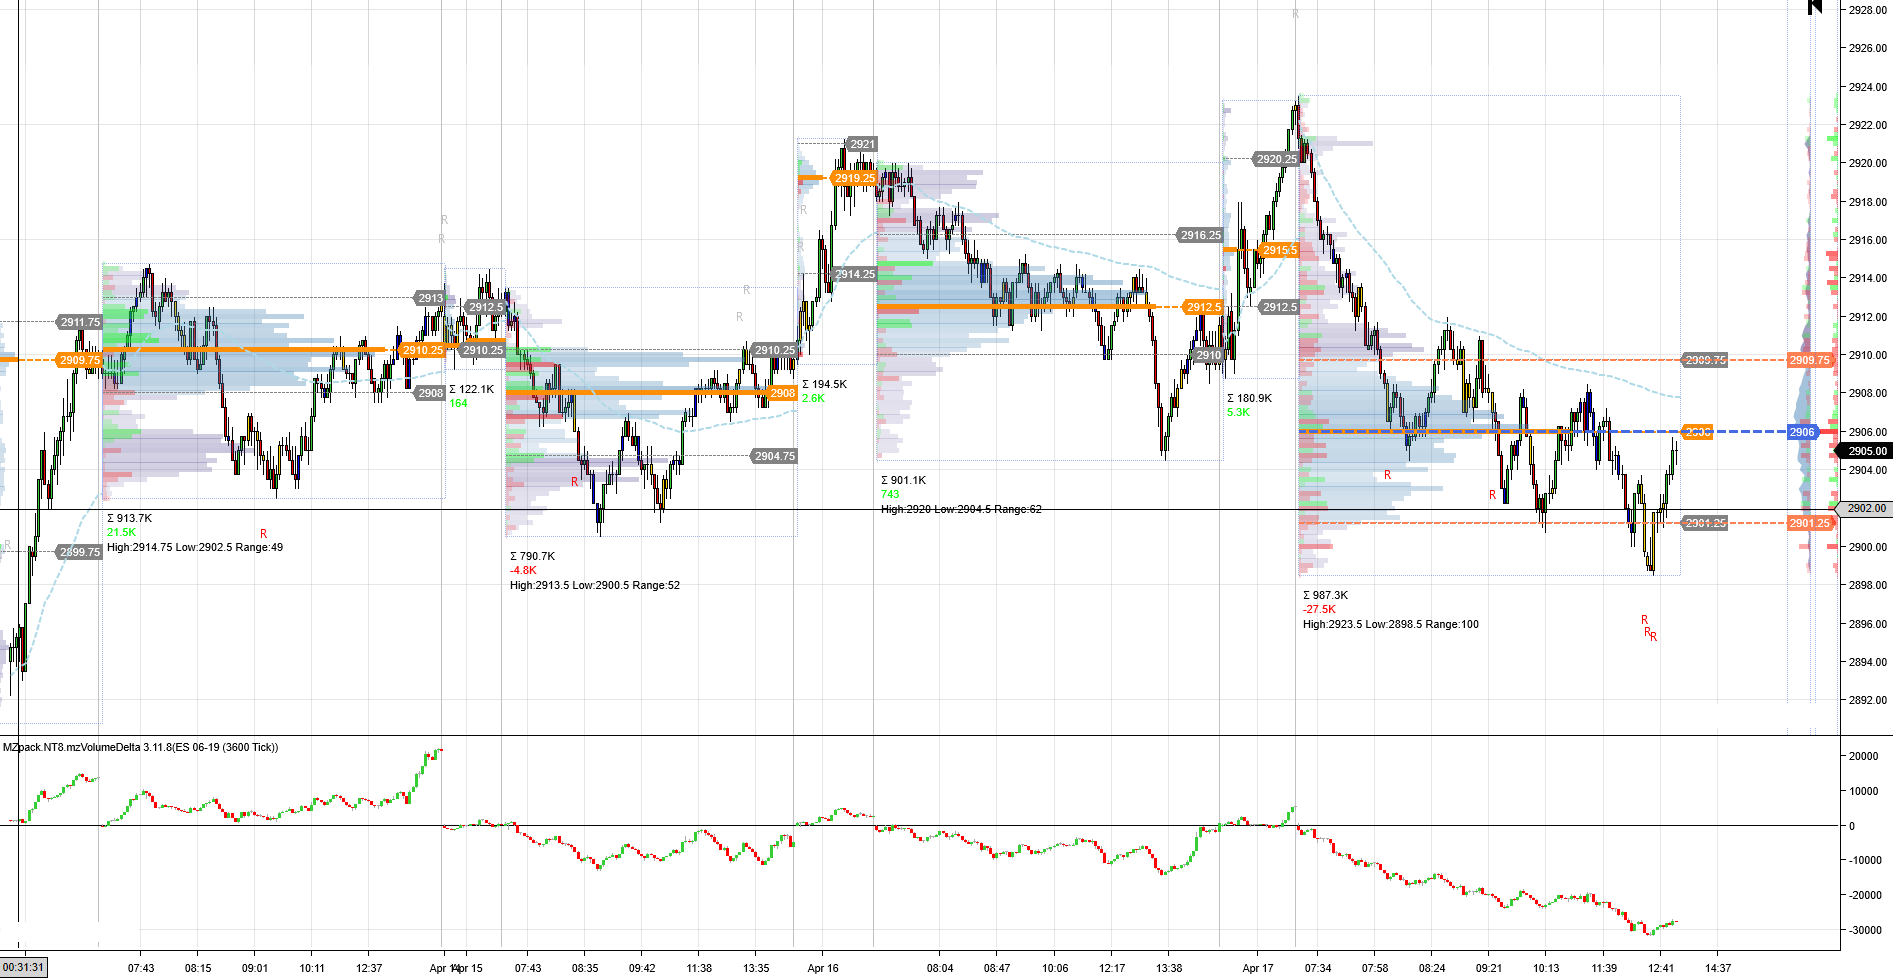
And intraday….too much to detail here in terms of usage (I would be writing this post for weeks) but shows ETH and RTH separated, with the value area and all of its relevant levels highlighted (high, low and point of control).
The bullet points above are flooded with opinions, I realize that. Most of what I do always has been, however. I, like many others, learn what I can about what has been done in the past and make my own interpretations based around it, or just find (what I think is) a new way to go about executing on it.
It is a reactionary approach. Do all the forecasting you want, you're still going to be wrong from time to time. Shorter term trading demands flexibility, so what's your approach on those days you're incorrect? This is one of the main reasons I've shifted so much over the years, and why many standard techniques using prices alone are looking for more. You are always better off marrying the long term with the short, and getting the most comprehensive view of what you're trading overall.
Hope this helps. I've had this itch to get these things down on the blog for a while now and as I say, use it as a reference.
If you're looking to get started in profile, again, just go to the original or near original sources and build from there. Like anything else, it is going to take time and commitment. The way I use volume profile is in many ways, very, very different than what is discussed in these books, but I don't think there's anything wrong with that. What would be odd is if I, or anyone else, copied everything verbatim. Bear that in mind, and thanks for reading.
-Steve


