A lot has changed over the years with this site, and along with it, me. I see other people out there with an unwavering system of beliefs, sticking to (what I view as) an archaic way of looking at things and unflinching to change. I'm not sure why they do this, but imagine a lot of it boils down to not wanting to appear as a shapeshifter of some kind or post anything that could in any way contradict what they have written in the past.
I look at it this way: I upgrade my phone every 2 years (along with many other things) so obviously I am going to want to upgrade my business as well. This has always been the fun part, as far as I see it. This is not to be confused with “if it works, don't touch it.” Performance enhancements only here.
None of the below is “right” or “wrong”. Throw darts at a chart if you want. If it makes money, that's all that matters. I will never criticize someone for what he/she is using. 16 years in this business and I still learn new things all the time.
Daytrading is extremely difficult to implement. Finding something that works is rarely the issue. Assembling the strategy and getting it up and running properly is where the bulk of problems arise.
Most forms of analysis can be optimized and made profitable, but some things pose far more friction than others.
And even as most people get older, build experience and so on, this is still challenging. Much of it boils down to expectation. Once you realize what is realistically achievable, what is “normal”, and so on, the friction tends to drift away.
Most of us try to build the impossible. We all have limits based on our current levels of expertise. You can't do everything.
If we were to dumb down the decision-making process for most participants, we would see the following being analyzed:
fundamentals > volumes > prices.
Following each of these items, you could toss in an arbitrary trading model, which would look something like this:
fundamentals > trading model > volumes > trading model > prices > trading model.
Some people use only one of those models, others a hybrid. And the more layers you stack on (such as any indicators) the further removed you are from the beginning. Don't ever forget that.
I urge getting behind prices as much as possible. The further back you go, the better, because you're getting an early lead on a slew of other participants who are only reacting to what has already been done. If you are using prices to confirm what you already, objectively know from both a fundamental and volume-driven perspective (assuming it is tested and accurate), then you clearly have an advantage over a newer trader relying solely on a support and resistance level getting hit.
Like many other professions, this one is built on information. Getting it, dissecting it, and using it properly.
Combining these stages gives you more information, but can slow you down in the execution process. This is fine as long as you adjust to it. I use a hybrid of all three, which obviously works at various frequencies.
So let's go down the list. Not a lot of surprises here, but I thought some of the explanations might be helpful.
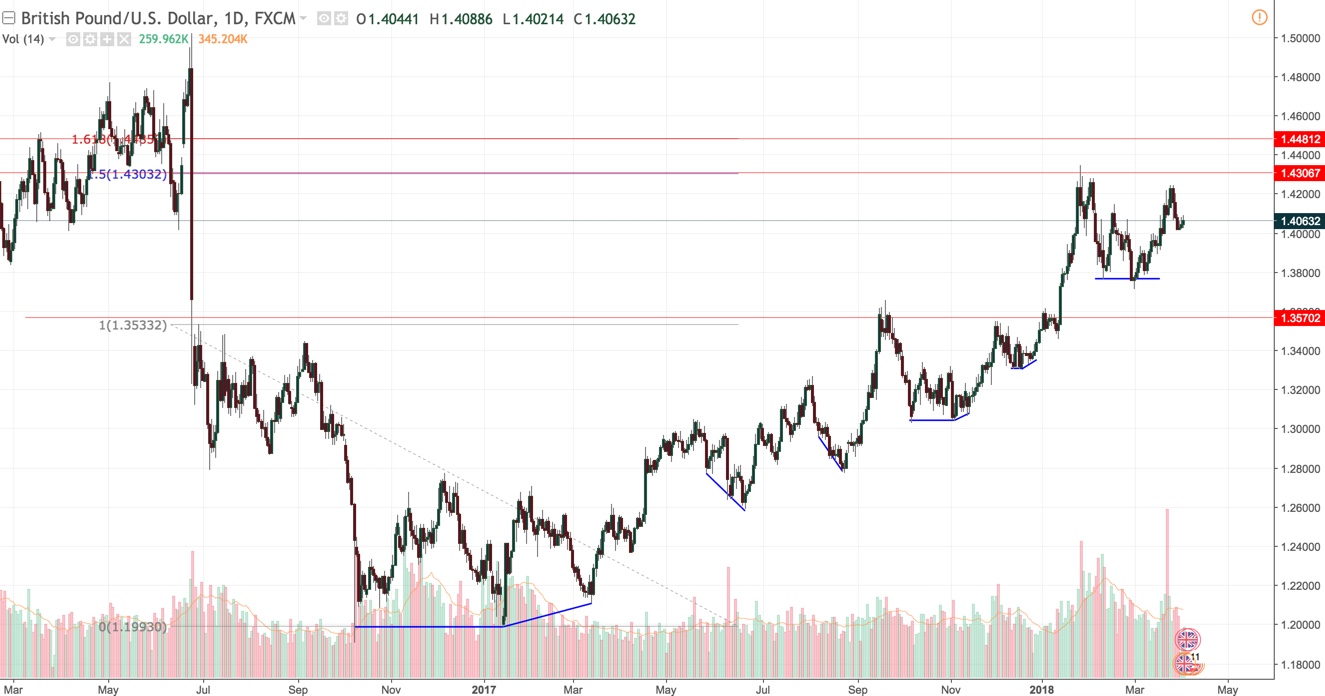
Price Action
Early on, price action got me moving in the right direction from a structural standpoint. I used to look at charts and ask “how does anyone make sense of this” to looking at charts and being able to tear it apart like any other language.
The problem I always found, however, with price action on its own, is that I only loosely understood why these things were occurring (assuming at the time I had absolutely zero knowledge in regards to volumes). Why prices would bounce off of a level over and over and over again. Why prices would gravitate to previous areas of consolidation.
It was all just boiled down to statistics and a series of coincidences that were loosely tied together. In other words, observation and impact. And while in many cases, this is more than enough to assemble a strategy, from a daytrading perspective, this can pose a high number of problems.
Little did I realize at the time, that timing was ultimately what I was improving, not direction.
Using price action alone, direction can be determined via a series of price breaks, large pauses at major support and resistance, classic chart patterns, and so on. But as we all know, the underlying performance of these types of methods is mediocre at best. The stats themselves vary wildly based on the pattern and methods being used but overall, they are prone to “fakeouts” and other things which people tend to commonly label as being fooled.
Price action is the end result of a very long decision-making process by a wide number of participants. It is the last thing to happen in a process which starts out very broad, and funnels itself into specifics. What I ultimately discovered is that price action is a framework for improving market timing and environment, but can be painful in a number of categories, namely:
….how long will the move last?
….are you being “faked out” by a false break, or some other nonsense?
….where are prices ultimately headed / what are they being drawn to?
….which level is going to hit? And why?
Yes, we can define “rules” for all of these items, but what we end up with is a spider web of conflicting information and rule, after rule, after rule, after rule. For an algorithm, that's fine. But for a discretionary trader, its impractical. With many of my early studies in price action, I found this to be the case. Authors writing 100s of “if, then” statements, and I find myself becoming an expert in figuring out their brain, but not much else.
Its like trying to learn a new, complex piece of software. Step one is to get into the head of the creator and figure out where everything is and the steps required to achieve any number of tasks. Its taxing, and why a lot of people eventually give up.
By putting the focus on something far more fundamental, that changes. Global concepts can be transferred and nuances apply less so.
The questions listed above are just examples of where price action struggles on its own. They can be answered, but the data behind them won't have you doing backflips.
It is the constant adjustment which has always driven me nuts. People say that trade management is the hardest part of trading. I argue that it should not be hard. It's binary. Either one way or the other, and over a predefined length of time. You shouldn't have to adjust everything on the fly all the time – you'll never sleep.
If you're stressed out, battling back and forth between a strategy which requires constant directional judgement, there is likely a clear reason why.
I am not knocking price action by any means, far from it, but rather explaining that it does have limitations where other means of analysis can fill the void. Price action is wonderful for understanding typical market behavior, as well as precisely defining entries and exits. I cannot go without it. But again, I would rather view it as a framework, not the end-all. This is the objective side of me kicking in.
Aggregate Volumes (X Axis, Standard and Y Axis, Volume Profile)
I separate volumes into two primary categories: total executed, and anything more granular than this, including transactions executed on the bid/ask (delta), as well as liquidity (depth of market).
Total executed (aggregate) volumes serve two purposes:
Environment and price turning points (volumes plotted on the y axis): When and where prices are going to get “stuck” (generally speaking, at high volume nodes) vs where they will run / deflect (low volume nodes). Acceptance and rejection is a basic principle of volume / market profile which holds true in in any environment. All support and resistance levels can be directly tied to volume profile.
Early directional signals (volumes plotted on the x axis): combined with location, high volumes are indicative of either an impending reversal or breakout. Low volumes are indicative of either short term fills (aka single prints or liquidity gaps) or pullbacks
The information provided to you here provides a number of benefits that can either behave as a precurser to prices themselves or confirm what is already seen.

Split Volumes (Cumulative Delta)
Split volumes can provide some massive benefits, but only if you're using them properly. Over the years, I have found that most interpretations of split volumes are generally misguided, which is why I recently posted some videos to reflect it. Split data refers to transactions executed on the bid/ask. You'll need an exchange or (generally) access to a liquid ECN for interbank FX. I use CME futures data when I'm looking for split volumes in FX (or any commodity, of course). They are more than reliable for my purposes.
Split volumes are used for direction. At the end of the day, all we need to know is if prices are headed high or lower, and in what specified timeframe. For an average daytrading frequency, I have tested countless numbers of methods for determining this, and keep going back to just cumulative delta, albeit using a less conventional approach to interpretation.
I rely on it heavily for virtually all markets, but especially very saturated (liquid) ones. Where limit orders run the show, as they do in most markets, split volumes tell you what more influential participants are doing.
Liquidity
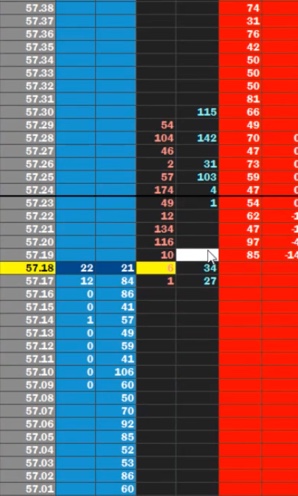
If skewed, the common assumption is the fade. Let's say I have 2x the number of bids versus offers, 4 levels away from the current price. Common thinking would direct me to buy, arguing that market orders cannot penetrate to the downside, but this is not always the case because:
- Those bids can be pulled in microseconds or
- An extreme number of market orders can wipe them out and take prices lower.
#2 is the typical culprit, but truly, none of it matters. If the logic is flawed, your strategy is going to fall apart in some conditions, and thrive in others.
We want to know what the “others” are, and use them as a supplement, so long as the data proves the validity of the thesis.
In my case, this is when the limit order book is clearly buying (determined through cumulative delta) and market orders to sell are drying up. It is used for more precise entry only, and largely ineffective for daytrading use elsewhere due to the frequency of the data.
Liquidity is an area I have the most interest in further exploring, although I am not sure where else I can turn at this point. It is an area which is the most prone to manipulation and overall quick changes best observed by an algorithm only.
Fundamentals
This varies wildly by instrument. Prices are the sum of parts. Typically, there are only a couple of major components which constitute the bulk of decision making, with others either leading those or weighted significantly less.
As an example, for FX, its interest rates, as they are, essentially, the cost of money. From a fundamental perspective, there is nothing that moves foreign exchange pricing more than this. We have leading indicators of rates: inflation, debt, even forwards, etc.
For commodities, its typically the cost of several components which creates the end product as well as the unserved demand, which is the function of other factors.
Again, we want to go as far back down the trail as possible in order to get a lead on the competition, thus prices. My preference is always pricing models: it allows you to create a hypothetical price based on fundamental knowledge alone, assisting you in the long and short term process. The higher the r square, the better. You are essentially trying to track price without directly using it.
You can then rip apart that data to determine undervalued/overvalued, or any other number of metrics.
There are models for nearly every commodity, rate and equity on planet earth. Google them. Find out what the primary drivers in your market actually are, and how to get as far behind them as possible.
Lost yet?
Here we go again – reading an article and trying to get inside the brain of the creator. Yes, I get it.
So let's summarize. My years of experience had less to do with learning facts as it did perception, because I find what most people are told is usually an “obvious” way to perceive something, but oftentimes impractical for use.
Price action builds the base and provides me with structure. It lets me know where I am on the overall roadmap. It also lets me know where prices might shift, as well as potential entries and exits. Having a heads up on these areas and overall price structure is a large advantage in the long run.
Aggregate volumes = heads up on impending movements and trading environment. There really aren't many signals generated from aggregate volumes and they are relatively easy to learn (plotted on both the x and y axis). Traditional concepts are generally effective here.
Split Volumes = simple direction, up or down. I was never able to find an explanation for this that satisfied me, so I created my own here and here.
Fundamentals = overvalued / undervalued form a macro perspective. Put your emphasis on creating an equation from price. x + y = price. Keep it relatively simple and know your primary drivers.
And with this list alone, there are thousands of ways to apply it. Write rules, and think like an algo. Harden your process and remove the thousands of conflicting “if, then” statements. The vast majority of people do not do this, and find themselves either entering early, without confirmation, applying poor risk or enter positions without knowledge of where the trade is going. Gather data. Spreadsheets are your friend.
And that's it for today. I have been traveling for the last week and hope to get more up when I return. Thanks as usual, and good trading.


