Over time, we have talked quite a bit about the “rule of 3″, which is a very common yet underestimated component of trading. And the reason I use the word” underestimated” is because for learning purposes, it could be one of the clearest, simplest and easy-to-follow concept that leads to the most favorable results.
The “rule of 3” could refer to a number of different things:
1. It takes 2 points to create a trendline. The third one will fade. Any hit after the third weakens the line until it becomes buried in the past, at which point its relevance is once again strengthened.
2. In higher probabilistic scenarios, price will exhaust on either a short or long term basis following 3 taps / drives.
3. There are always 3 legs to each major component of a trend. It is perhaps an easier and less confusing means of identifying various stages of a trend. More on this coming soon.
4. When price pauses within a trend, it typically creates 3 consecutive “bucks” prior to continuation.
These “rules” are of course able to be broken according to the other “rules” dictating nothing other than our friend reality. And so they should, in this case, be considered requirements prior to putting on a new position. This is how I treat them, and as usual if I don't see them, I don't take action.
Number 2 on this list (in higher probabilistic scenarios, price will exhaust on either a short or long term basis following 3 taps / drives) gets a good amount of attention on this site. I find that within every preexisting theory, no matter how terrible or broken other people may perceive it, there is a nugget waiting to be uncovered. I treat all of my analysis like this and so I am very hesitant to dismiss anything, as ridiculous as some of it might seem.
A question by a reader on our new board got me thinking about this more than usual during the course of the past week. She brought up harmonic trading. As usual and as with Elliot Wave analysis, when you take everything in aggregate and on a larger scope, it is hard to find the immediate value. The patterns are extremely detailed, thus confusing and difficult to remember.
More importantly, some of these price patterns simply work better than others. It is usually the smaller, more simple ones that work best. The only book I have ever read about Elliot Wave analysis was by Robert Pretcher. To this day, after the countless number of hours spent analyzing my charts, it is not easy to dismiss much of what is written in that book. What I have found so difficult is the suggested means of application. While the knowledge is important, the method lags (at least for me).
Certain forms of price action analysis (trend identification, bar patterns, etc.) certainly can and does lag just like any indicator, and you can't convince me otherwise. Bar patterns, etc., can be considered “lagging” as their completion is required to “confirm” entry or exit.
And so this is why I turn to extensions and other traditional forms of support and resistance. I have had far more success using them as opposed to any other form of chart measurement. It rings clear as a bell to me and the predictive “power” is something I am still impressed with to this day. Over time, of course, my confidence boosts as I have more experience doing it.
But back to those smaller patterns. I will completely admit here that when I started discussing “triple taps” on this site, I completely forgot about the traditional 3-drive pattern. Essentially it's the same thing, but with added measures. And it's funny: I read about it years ago…..how did I miss the importance? #1: it wasn't flashed in my face on a daily basis and goes under the radar in most written material. #2: no one tries to sell you on a hidden pattern so “regularly obscure” as it is.
All of the work on this site is a spinoff / variation of an old idea. I take conventional teachings, try to find the good, and make the nuggets work in manner that makes sense. Readers of this site are exposed to only the more exciting stuff, typically.
For instance: measured moves on trendline breaks…..the original method for drawing the measurement was described by Tom DeMark, but his method for drawing the trendline I found to be lacking in the precision I wanted, thus the measurement was as well. He explained why he found his trendlines in this manner (to quantify them) but that doesn't mean that it is the best way to go about it. When I found a better way to do this, I achieved much better results, so good that they seemed scary as to how accurate they were. They key to doing those was to 1. find the retest in the last leg…..this is how you know you're same page as the rest of the market and 2. line that up with heavy confluence in the previous price range.
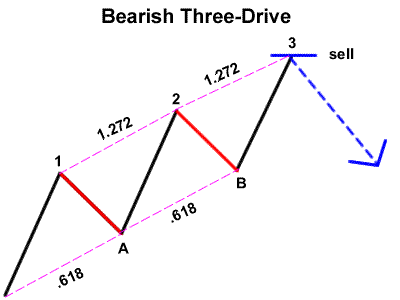
So onto our triple tap / 3 drive pattern: yet again, I find the original explanation and means lacking clarity and ease of use. Most people initially see these drawn out examples, something that looks like this:

Looks great, right? But the problem is twofold: 1. the measurements themselves may or may not be accurrate and 2. the location of these in a live trading environment. And this is one of Elliot Wave theory's more common hindrances: the ability for people to translate the above into a live, at-the-market situation. Practitioners will argue otherwise, but they have experience working heavily in their favor (as it should be). Price doesn't look anything like this. It shoots and shifts all over the place. Locating waves and their subs can be very difficult, and most people give up before they even really start.
Some initial observations about the drawing above:
1. Point 3 is typically 1.618 of the initial drive. You always want to give that leg more room because new money is getting in based on the first instance. This new money enhances length of the movement.
2. The dotted lines labeled 0.618 might, or might not be. Sometimes yes, sometimes no, but ultimately it is not consistent and should a trader assume they were they might find themselves getting destroyed on a trend continuation, which happens all the time.
In other words, it is dangerous and unrealistic to make assumptions like these. Any market is harmonic to the point of what just happened before it, but not all the time.
I have a lot of experience trading these by now. Here are my observations:
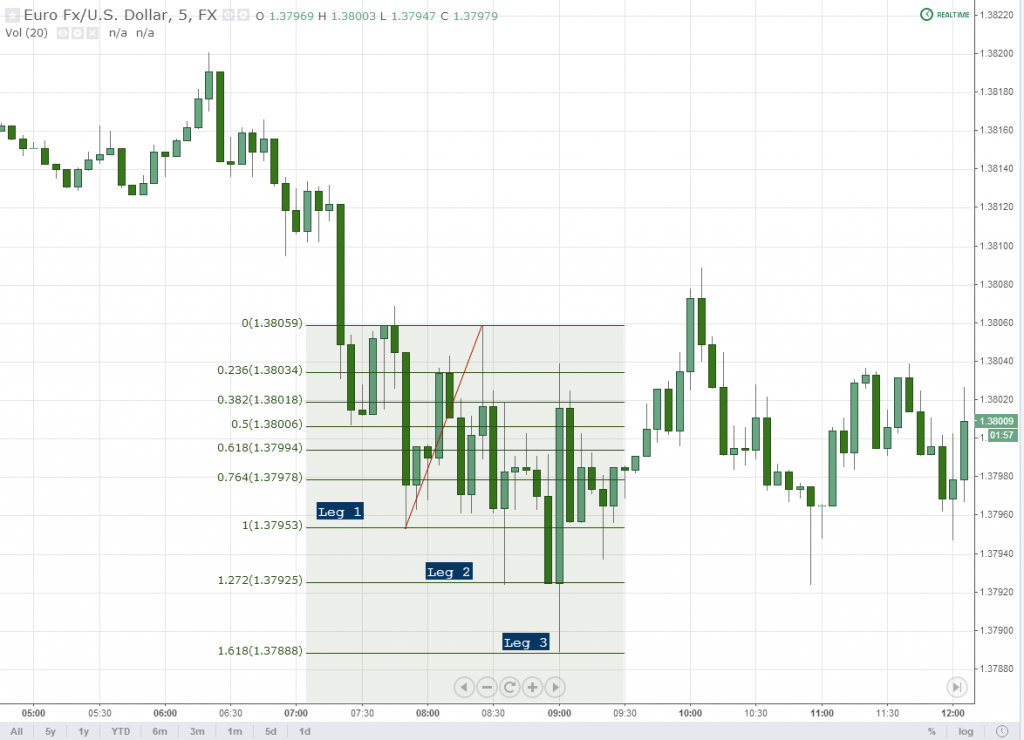
1. 1.272 occurs on the second point.
2. 1.618 occurs on the third point.
3. Up to 4 points can occur. If this is the case, #4 typically coincides with a 2.0 extension.
4. Everything gets measured from the first drive.
Here is a real example, found on a 5 minute timeframe:

There are TWO primary situations in which you will find these.
1. Against the macro trend (creation of a new) – no major fundamental stimulus is present and buyers and sellers are still attempting to latch onto the major, preexisting trend.
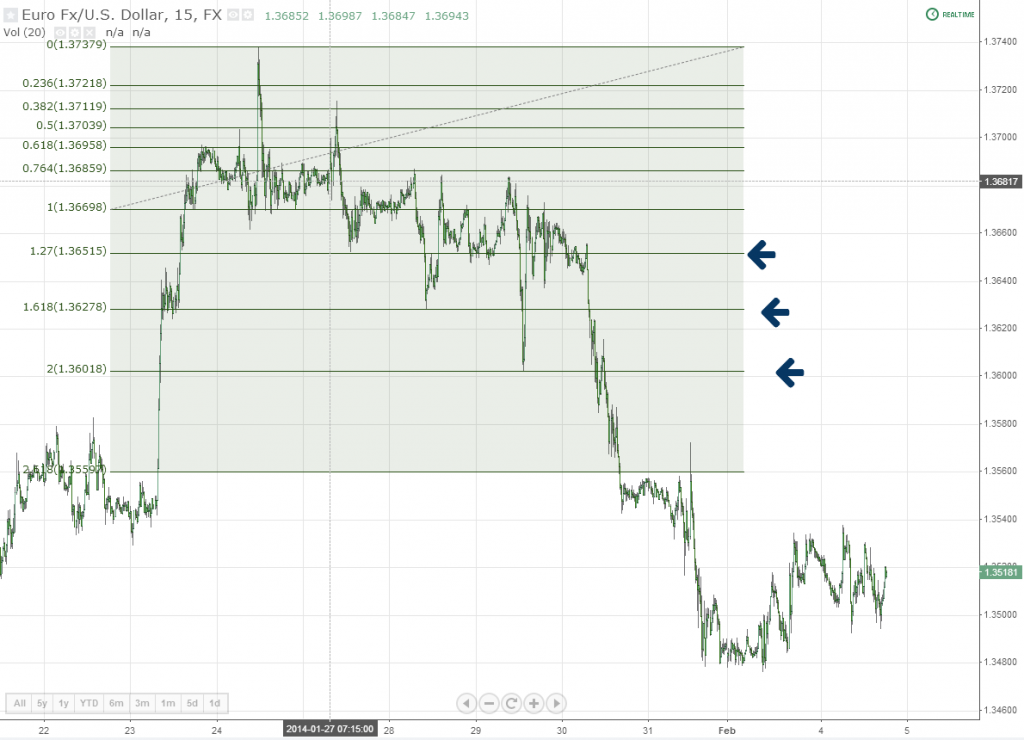
The inspiration for this post comes form this recent move on EUR/USD, which exemplifies the above. What's happening here is rather obvious and based on my findings above. This also happens to be in the right scenario, with the proper circumstances:

Briefly explained, we measure the first drive. A hit on 1.272 opens the gates to 1.618 as a responsive level. Then down to 2.0. These are of course countertrend, but that's the point.
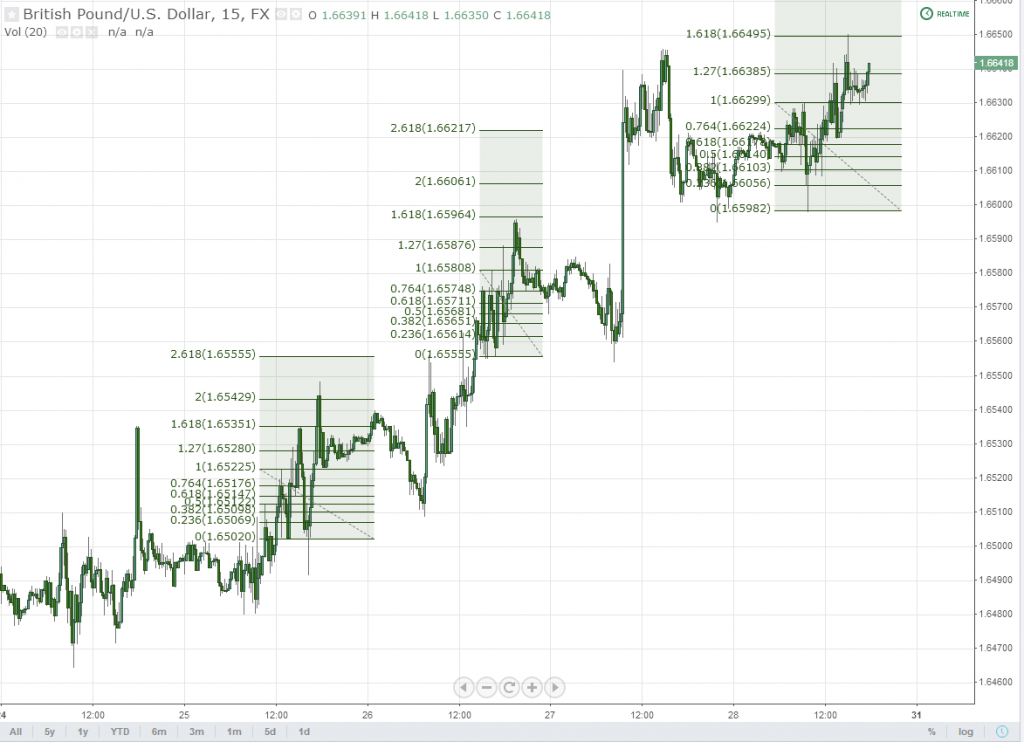
2. Within the macro trend – As temporary stalling points for price. I trade a lot of these intraday to boost earnings, and they offer objective levels for taking profits and capping risk.

I shouldn't need to say this, but these patterns are best used in the context of other levels that reveal confluence to an overall logical stalling point for price acceleration.
This market is extremely technical, which is great. The poor results tack in when following conventional wisdom. Without even knowing it, people tend to abide by certain rules. These rules can be objectified, and our job is to simply find them. Exploiting anomalies in human behavior is what trading really about, in my opinion. You have to see the forest for what it is: a bunch of trees. If you envision a bunch of leprechauns hanging out next to the rainbow then you're going to get yourself in heaps of trouble.
The rubber rarely hit the road at any given moment in this market. This is very much like most other more liquid markets. It is, in fact, rare to find a market these days where this occurs. And this is precisely why adaptability and the understanding of the human element is crucial. These patterns simply demonstrate human behavior, whether intentional or not.
The “Rule of 3”, when it comes to drives, can be objectively measured in order to arrive at logical and precise turning points. But use it wisely, and understand that the ultimate yield on the trade will only be commensurate with the macro environment. There are truly endless ways to trade these; this is yet one more exception.
——
And that's it for today. As I think it is obvious, I have been rather busy these days but with more time opening up soon. As usual, please feel free to post any comments below.
Thanks,
Steve


