Update 11/26: In this one and placing my stop at 1833 currently. This is a little higher than I normally go but then again the risk allows for it. The “official” calculated number comes out almost exactly at 1827 but giving it another 6 point buffer. Indicators showing the lower supporting trendline about to be busted. Our high came today at 1808 and I wasn't ready to miss out over only 4 pts, just in the event this is indeed a point of failure. Short term, we have a small scale triple tap developed at the highs here and today's bar is shaping up to shooting star formation, although the bar pattern only has around a 59% performance rate as a standalone. For the divergence junkies, we are heavily so. Other factors / technical decision process below. I could rant on about news-driven drivers and behavioral sentiment but just take one look at he headlines these past couple days and judge for yourself.
—————
There is a reason I don't post trades on this site anymore, as I've explained many times before, reader recklessness being the primary reason, but I can't help but want to get this up here today. The headlines are nothing short of expected as the S&P 500 makes its new highs and while the ongoing cheerleading is persistent I find myself, yet again, with upper resistance from a common movement in price. This one, however, is rare in the sense that it is unfolding on such a scale, and on such a major index.
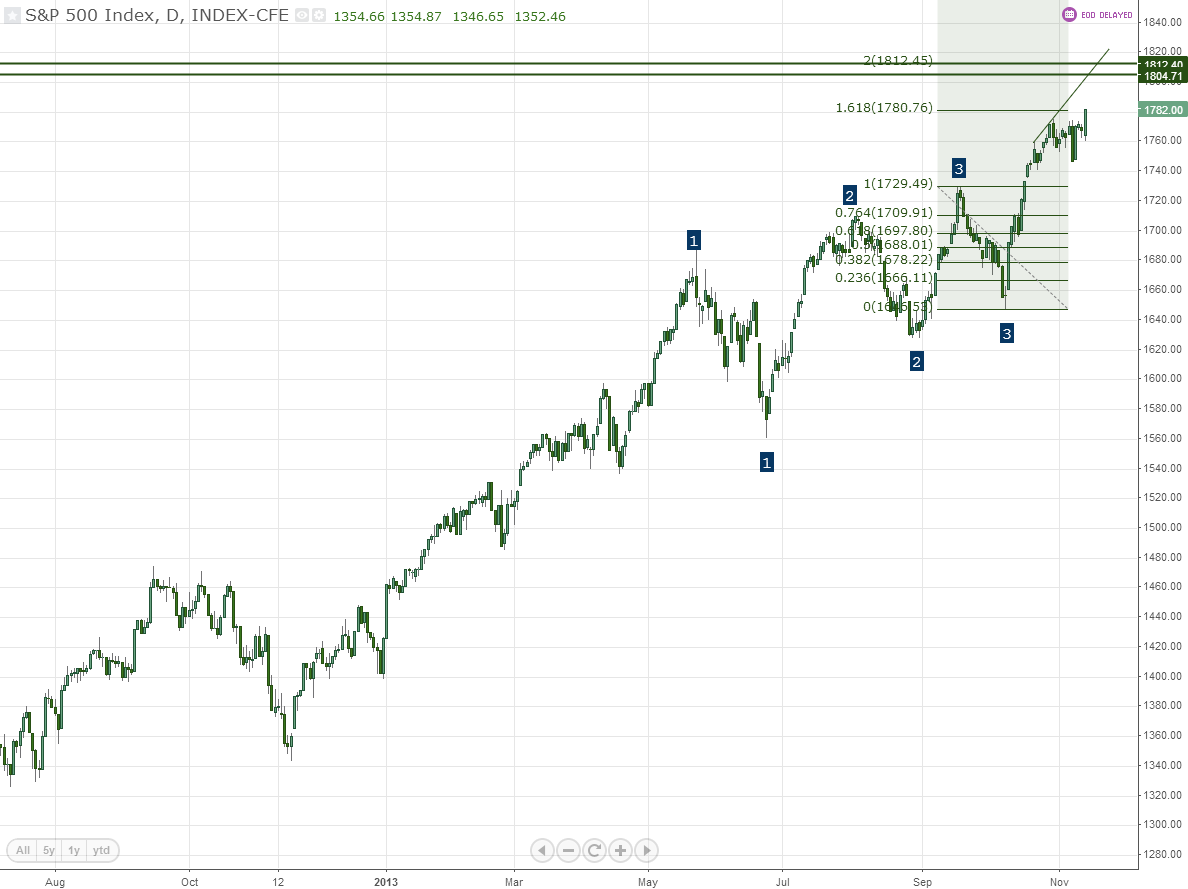
The logic here is simple – following a triple tap, there is an extension of the range that equals approximately 2X the final pullback. This thrust is usually sharp and parabolic, and equal in terms of its rapid failure. Price will likely retreat from where it came back to the high 1700's.
We see this happening over and over again in all markets, but this movement has been nothing less than monstrous. I feel the need to note here that 1780 was the initial extension and sometimes indeed, this fails, which is why I am using it as a target. So just a ~30+ point move here. It can also be used as an entry point to get long once again should the situation present itself.
For added confirmation, we can look for short term topping structures again, this move is typically sharp, so that might be difficult in this case. We're at the golden ratio right now, and so this is where you typically find longs dumping.
Fundamentally, this is a market that has been playing along with the fiddle of the Fed. In other words, Fed says, we do. It has been that way since the first round of QE. But we now have the first few whiffs of extermination on this heavily debated policy, and so we're forward looking in terms of its ultimate disposal, however that may come. We have already heard about the potential for reversal, and now it becomes a matter of how that gets done. In the meantime, I say play the pullbacks.
So we'll see. I'll update this post if anything changes because it does all the time, and this is a longer term setup. I plan on shorting just above 1800 with a stop TBD based on local range measurements. 1804-1812 (the latter being the most common culprit) are the levels.