I have mentioned these in quite a few posts in the past, but never gave them the attention they truly deserve. When nothing is really “new”, I say it, and this very simple yet grossly common pattern falls into that category. The reason I have never posted this pattern by itself is because it is so mediocre when taken for face value as a standalone. But I wanted to get this up prior to a post regarding methods for trade confirmation, as they no doubt serve as one of my more common methods for doing so (all contextually-based, though….eg I never use them alone).
So as told in the title of this post, these are triple taps, but simply go in the underlying direction of your trade. Unlike our normal triple taps, I almost always seek out some form of bar confirmation (discussed in the next post) or other price-based indications (such as retests on trendlines) after they occur. With normal triple taps, I oftentimes get in the market immediately on the third or fourth lunge, with no bar confirmation (but always a supporting price level).
These are very simple to identify, and they're everywhere – they're so common you can get dizzy looking for / at them but again I will talk more about context in the next post. Once again I point back to the relevance of the number 3 when it comes to anything price action….these of course are no exception.
The simple rule to remember here is that you're looking for lunges that have higher lows (for a long position) or lower highs (for a short position) but not necessarily clean hits on a trendline.
Like most positive trading systems, it's not the complexity of the pattern that is relevant, it's the contextual nature of the trade. When all your puzzle pieces are put together, you can ultimately see the image, so to speak.
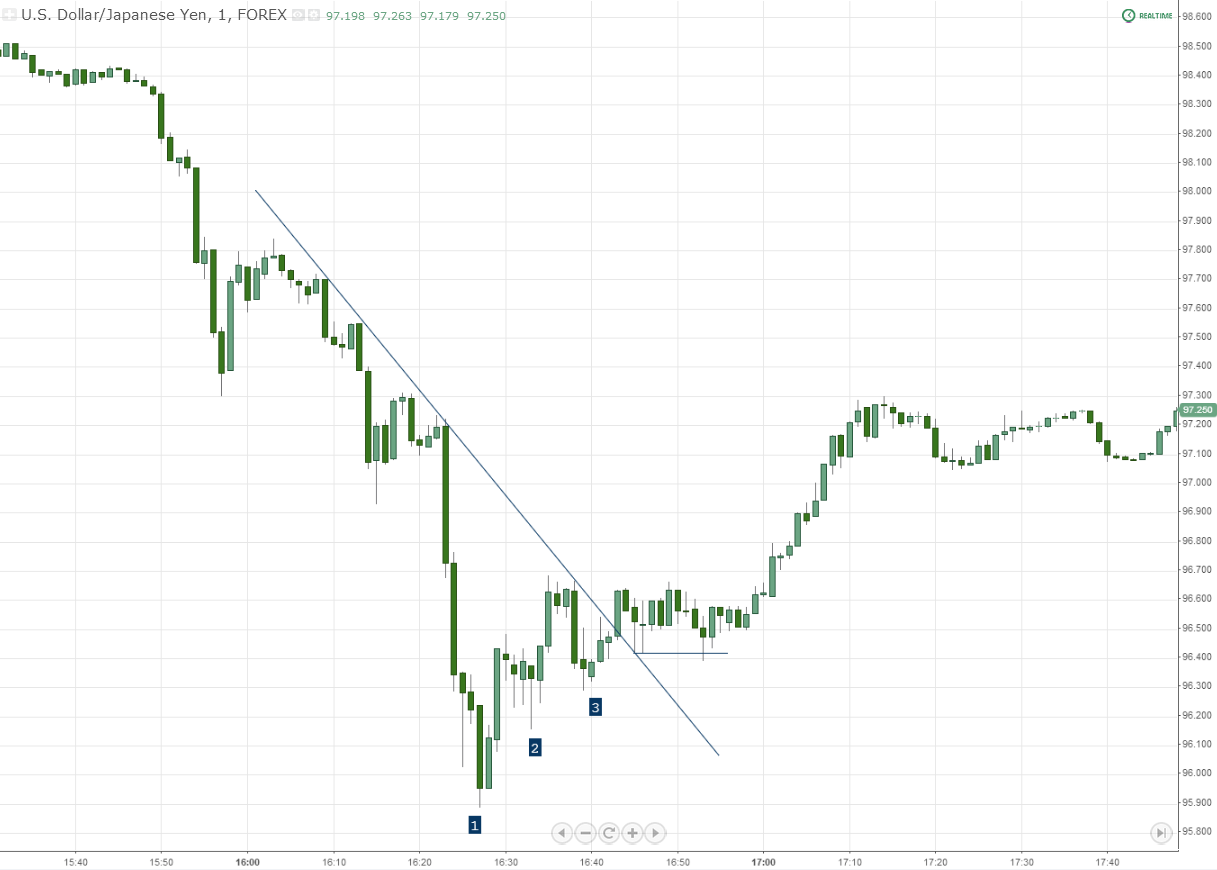
Example 1: Yesterday's Yen Buying Frenzy
Three upward lunges, later supported by a backward retest on a short term trendline, short term target hit (golden ratio extension, explained here). Take note that the other two legs of this trend were NOT supported by these patterns.
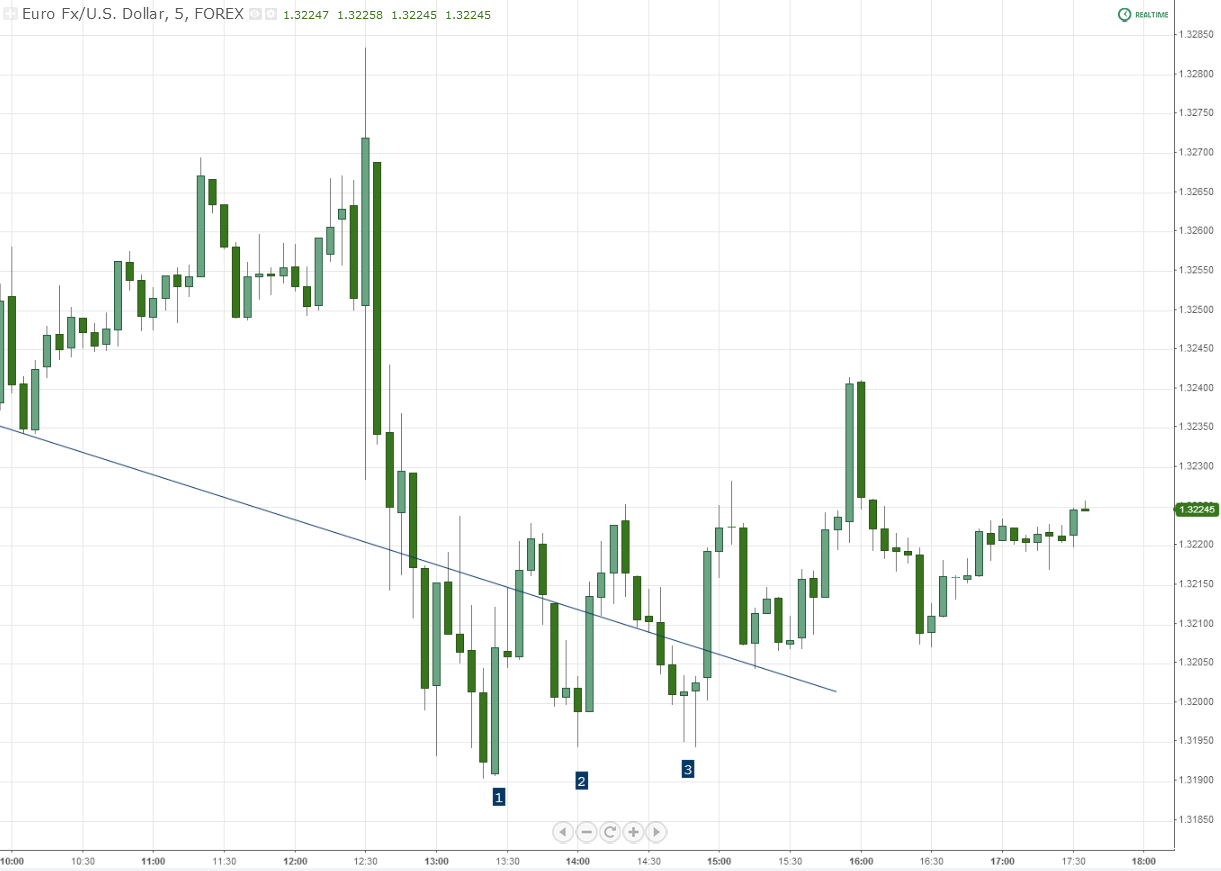
Example 2: Today, EUR/USD following nonfarm payrolls
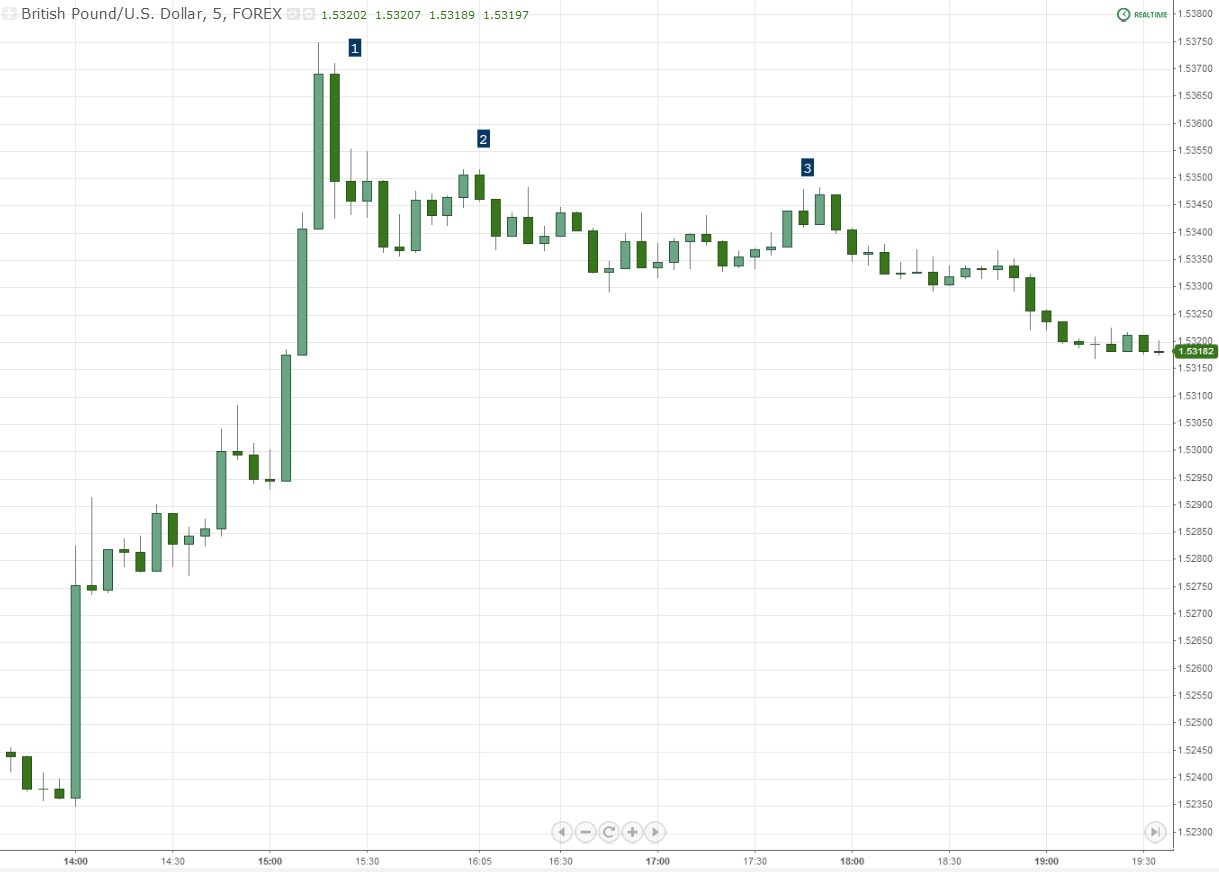
Example 3: Following an aggressive spike in price on GBP/USD. Highlighting this “messy” example to emphasize the fact that that you're looking for lunges, not always specifically a clean, linear trendline.
So do I expect many people to be “wowed” by this? No, but their use in conjunction with other ideas structured on this site can be invaluable. If not for anything else, they can be used as a heads up on staying out of a potentially bad trade.
Here is a short list of recent posts in which I've discussed these, to give you more examples /various contextual references:
Event-Driven Spikes in Forex Prices – Defining, Measured Moves and Trading
Becoming a Fluent Chart Reader – Clarity in Price Action
Mechanical Trend Trading Strategy: Adaptive Entries Using Acceleration Launchpads


